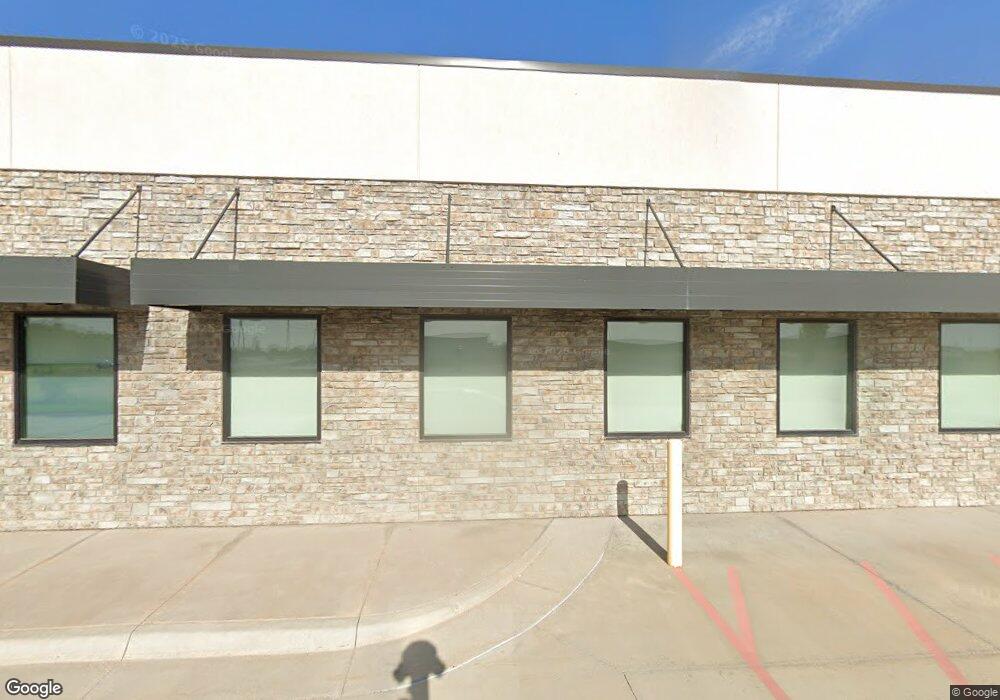
2051 E Mary St Garden City, KS 67846
--
Bed
--
Bath
10,933
Sq Ft
1.21
Acres
About This Home
This home is located at 2051 E Mary St, Garden City, KS 67846. 2051 E Mary St is a home located in Finney County with nearby schools including Florence Wilson Elementary School, Kenneth Henderson Middle School, and Bernadine Sitts Intermediate Center.
Ownership History
Date
Name
Owned For
Owner Type
Purchase Details
Closed on
Mar 11, 2022
Sold by
Obryan Llc
Bought by
Lej Properties Llc
Purchase Details
Closed on
Jul 30, 2021
Sold by
Drs F Llc
Bought by
Obryan Llc
Home Financials for this Owner
Home Financials are based on the most recent Mortgage that was taken out on this home.
Original Mortgage
$3,211,000
Interest Rate
2.8%
Mortgage Type
New Conventional
Purchase Details
Closed on
Jul 2, 2021
Sold by
Strandmark and Jean
Bought by
Drs F Llc
Home Financials for this Owner
Home Financials are based on the most recent Mortgage that was taken out on this home.
Original Mortgage
$3,211,000
Interest Rate
2.8%
Mortgage Type
New Conventional
Purchase Details
Closed on
Aug 17, 2015
Sold by
Pendergraft Clifford K and Pendergraft Mary L
Bought by
Pendergraft Clifford K and Pendergraft Mary L
Purchase Details
Closed on
Jun 8, 2015
Sold by
Strandmark Richard and Strandmark Jean
Bought by
Drs F Llc
Purchase Details
Closed on
Aug 31, 2007
Sold by
Bell Belinda J
Bought by
Gmac Global Relocation Services Llc
Create a Home Valuation Report for This Property
The Home Valuation Report is an in-depth analysis detailing your home's value as well as a comparison with similar homes in the area
Home Values in the Area
Average Home Value in this Area
Purchase History
| Date | Buyer | Sale Price | Title Company |
|---|---|---|---|
| Lej Properties Llc | -- | None Listed On Document | |
| Obryan Llc | -- | None Available | |
| Drs F Llc | -- | None Listed On Document | |
| Pendergraft Clifford K | -- | None Available | |
| Drs F Llc | -- | None Available | |
| Gmac Global Relocation Services Llc | -- | None Available |
Source: Public Records
Mortgage History
| Date | Status | Borrower | Loan Amount |
|---|---|---|---|
| Previous Owner | Obryan Llc | $3,211,000 |
Source: Public Records
Tax History Compared to Growth
Tax History
| Year | Tax Paid | Tax Assessment Tax Assessment Total Assessment is a certain percentage of the fair market value that is determined by local assessors to be the total taxable value of land and additions on the property. | Land | Improvement |
|---|---|---|---|---|
| 2024 | $88,138 | $565,748 | $39,868 | $525,880 |
| 2023 | $88,138 | $545,571 | $39,868 | $505,703 |
| 2022 | $76,207 | $457,070 | $37,665 | $419,405 |
| 2021 | $71,614 | $428,223 | $37,665 | $390,558 |
| 2020 | $74,712 | $454,558 | $37,665 | $416,893 |
| 2019 | $72,993 | $450,410 | $37,665 | $412,745 |
| 2018 | $72,598 | $449,835 | $37,665 | $412,170 |
| 2017 | $72,574 | $0 | $0 | $0 |
| 2016 | $2,756 | $0 | $0 | $0 |
| 2015 | $831 | $0 | $0 | $0 |
| 2012 | -- | $0 | $0 | $0 |
Source: Public Records
Map
Nearby Homes
- 2402 N Koster St
- 2808 N Broadmoor Place
- 1810 N Koster St
- 2302 E Fair St
- 2008 N Antler Ridge Dr
- 2065 Cottontail Ct
- 2075 Cottontail Ct
- 2090 Cottontail Ct
- 2055 Cottontail Ct
- 2085 Cottontail Ct
- 2095 Cottontail Ct
- 2060 Cottontail Ct
- 3208 Primrose St
- 2504 N Carriage Ln
- 2617 N Coachman Ln
- 2505 N Carriage Ln
- 1710 E Crestway Dr
- 1605 Remington Place
- 1601 N Remington Place
- 2001 Bison Dr
- 2101 E Mary St
- 2052 Labrador Blvd
- 2102 Labrador Blvd
- 2152 Labrador Blvd
- 1913 E Mary St
- 2051 Labrador Blvd
- 0 E Mary St
- 2101 Labrador Blvd
- 2501 N Campus Dr
- 2652 N Cherokee Rd
- 2301 Labrador Blvd
- 1927 E Sloan St
- 1927 E Sloan St
- 1927 E Sloan St Unit 1
- 1927 E Sloan St
- 2302 E Mary St
- 1925 E Sloan St
- 1925 E Sloan St
- 1925 E Sloan St
- 1925 E Sloan St