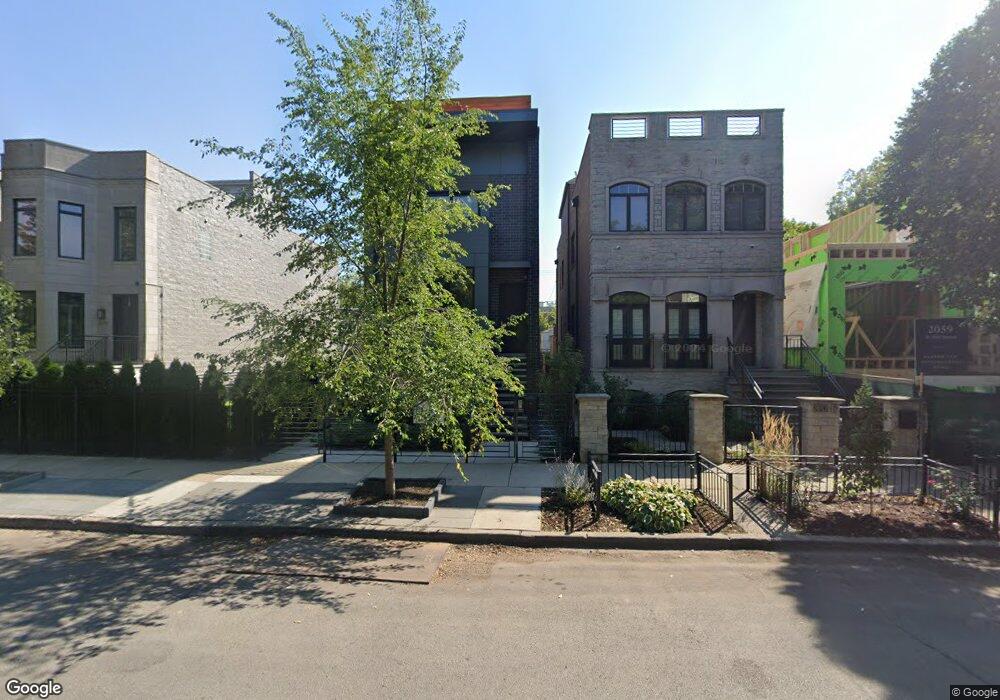
2055 W Erie St Unit 1 Chicago, IL 60612
West Town NeighborhoodEstimated Value: $1,564,000 - $2,039,000
5
Beds
4
Baths
2,562
Sq Ft
$673/Sq Ft
Est. Value
About This Home
This home is located at 2055 W Erie St Unit 1, Chicago, IL 60612 and is currently estimated at $1,725,075, approximately $673 per square foot. 2055 W Erie St Unit 1 is a home located in Cook County with nearby schools including Talcott Elementary School, Wells Community Academy High School, and St Nicholas Cathedral.
Ownership History
Date
Name
Owned For
Owner Type
Purchase Details
Closed on
Feb 13, 2025
Sold by
Trust Number 8002381050 and Chicago Title Land Trust Company
Bought by
Dixon Lauren
Current Estimated Value
Purchase Details
Closed on
Jul 17, 2019
Sold by
Srd Holdings Llc
Bought by
Chicago Title Land Trust Company and Trust Number 8002381050
Home Financials for this Owner
Home Financials are based on the most recent Mortgage that was taken out on this home.
Original Mortgage
$1,040,000
Interest Rate
3.12%
Mortgage Type
Adjustable Rate Mortgage/ARM
Purchase Details
Closed on
May 17, 2017
Sold by
Izzo Nicholas
Bought by
Srd Holdings Llc
Purchase Details
Closed on
Aug 19, 2015
Sold by
Izzo Anna Rose
Bought by
The Anna Rose Izzo Revocable Trust
Create a Home Valuation Report for This Property
The Home Valuation Report is an in-depth analysis detailing your home's value as well as a comparison with similar homes in the area
Home Values in the Area
Average Home Value in this Area
Purchase History
| Date | Buyer | Sale Price | Title Company |
|---|---|---|---|
| Dixon Lauren | $1,599,000 | Chicago Title | |
| Chicago Title Land Trust Company | $1,300,000 | Chicago Title | |
| Srd Holdings Llc | -- | Heritage Title Company | |
| Srd Holdings Llc Series 2153 Superior Ll | $460,000 | Heritage Title Company | |
| The Anna Rose Izzo Revocable Trust | -- | Attorney |
Source: Public Records
Mortgage History
| Date | Status | Borrower | Loan Amount |
|---|---|---|---|
| Previous Owner | Chicago Title Land Trust Company | $1,040,000 |
Source: Public Records
Tax History Compared to Growth
Tax History
| Year | Tax Paid | Tax Assessment Tax Assessment Total Assessment is a certain percentage of the fair market value that is determined by local assessors to be the total taxable value of land and additions on the property. | Land | Improvement |
|---|---|---|---|---|
| 2024 | $31,955 | $150,000 | $21,814 | $128,186 |
| 2023 | $31,058 | $151,000 | $17,568 | $133,432 |
| 2022 | $31,058 | $151,000 | $17,568 | $133,432 |
| 2021 | $30,365 | $151,000 | $17,568 | $133,432 |
| 2020 | $20,131 | $90,366 | $9,955 | $80,411 |
| 2019 | $14,912 | $74,219 | $9,955 | $64,264 |
| 2018 | $4,332 | $21,928 | $9,955 | $11,973 |
| 2017 | $2,522 | $11,717 | $8,784 | $2,933 |
| 2016 | $7,634 | $38,117 | $8,784 | $29,333 |
| 2015 | $6,985 | $38,117 | $8,784 | $29,333 |
| 2014 | $6,493 | $34,995 | $7,320 | $27,675 |
| 2013 | $6,365 | $34,995 | $7,320 | $27,675 |
Source: Public Records
Map
Nearby Homes
- 2059 W Erie St
- 2035 W Erie St
- 2036 W Erie St
- 2106 W Erie St Unit 1E
- 2127 W Huron St
- 2138 W Ohio St Unit 3
- 2002 W Ohio St
- 2005 W Huron St Unit 1
- 2055 W Race Ave
- 2059 W Race Ave
- 2049 W Race Ave
- 2035 W Race Ave
- 2149 W Huron St
- 1609 W Superior St
- 1956 W Huron St
- 2200 W Erie St Unit A
- 2203 W Huron St
- 2209 W Erie St
- 1934 W Race Ave
- 512 N Leavitt St
- 2053 W Erie St
- 2057 W Erie St
- 2049 W Erie St
- 2047 W Erie St
- 2043 W Erie St Unit 1E
- 2043 W Erie St Unit 1W
- 2043 W Erie St Unit 3E
- 2043 W Erie St Unit 2E
- 2043 W Erie St Unit 2W
- 2043 W Erie St Unit 3W
- 2043 W Erie St Unit 2
- 2043 W Erie St
- 2056 W Erie St
- 2056 W Erie St
- 2058 W Erie St Unit G
- 2052 W Erie St
- 2039 W Erie St
- 2048 W Erie St
- 2103 W Erie St
- 2103 W Erie St Unit 2