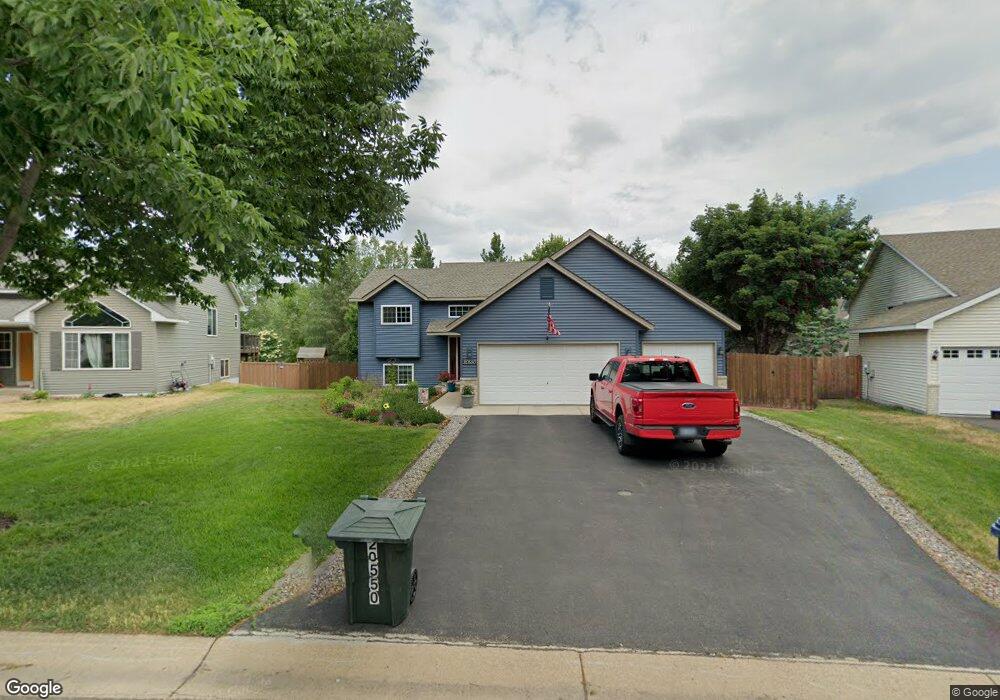
20550 Camden Path Farmington, MN 55024
Estimated Value: $403,000 - $419,000
3
Beds
2
Baths
1,870
Sq Ft
$219/Sq Ft
Est. Value
About This Home
This home is located at 20550 Camden Path, Farmington, MN 55024 and is currently estimated at $408,964, approximately $218 per square foot. 20550 Camden Path is a home located in Dakota County with nearby schools including Riverview Elementary School, Robert Boeckman Middle School, and Farmington High School.
Ownership History
Date
Name
Owned For
Owner Type
Purchase Details
Closed on
May 27, 2015
Sold by
Dockter Marcel L and Dockter Jennifer
Bought by
Bonsall Robert and Bonsall Laura
Current Estimated Value
Home Financials for this Owner
Home Financials are based on the most recent Mortgage that was taken out on this home.
Original Mortgage
$188,800
Outstanding Balance
$145,654
Interest Rate
3.64%
Mortgage Type
New Conventional
Estimated Equity
$263,310
Purchase Details
Closed on
Sep 2, 2005
Sold by
Adams Tiffany M and Adams Joseph U
Bought by
Dockter Marcel L and Larsen Jennifer
Purchase Details
Closed on
Aug 30, 2002
Sold by
C & M Home Builders Inc
Bought by
Adams Joseph U and Adams Tiffany M
Purchase Details
Closed on
Jan 17, 2002
Sold by
Ryan Real Estate Co
Bought by
C & M Home Builders Inc
Purchase Details
Closed on
Nov 15, 2000
Sold by
Rock Cliff Development Llc
Bought by
Ryan Real Estate Co
Create a Home Valuation Report for This Property
The Home Valuation Report is an in-depth analysis detailing your home's value as well as a comparison with similar homes in the area
Home Values in the Area
Average Home Value in this Area
Purchase History
| Date | Buyer | Sale Price | Title Company |
|---|---|---|---|
| Bonsall Robert | $236,000 | Title Smart Inc | |
| Dockter Marcel L | $256,000 | -- | |
| Adams Joseph U | $200,000 | -- | |
| C & M Home Builders Inc | $57,300 | -- | |
| Ryan Real Estate Co | $516,000 | -- |
Source: Public Records
Mortgage History
| Date | Status | Borrower | Loan Amount |
|---|---|---|---|
| Open | Bonsall Robert | $188,800 |
Source: Public Records
Tax History Compared to Growth
Tax History
| Year | Tax Paid | Tax Assessment Tax Assessment Total Assessment is a certain percentage of the fair market value that is determined by local assessors to be the total taxable value of land and additions on the property. | Land | Improvement |
|---|---|---|---|---|
| 2024 | $4,720 | $389,600 | $92,000 | $297,600 |
| 2023 | $4,720 | $389,500 | $92,100 | $297,400 |
| 2022 | $4,438 | $374,700 | $91,900 | $282,800 |
| 2021 | $4,176 | $318,400 | $79,900 | $238,500 |
| 2020 | $3,832 | $299,100 | $76,100 | $223,000 |
| 2019 | $3,600 | $267,100 | $72,400 | $194,700 |
| 2018 | $3,455 | $248,200 | $69,000 | $179,200 |
| 2017 | $3,342 | $232,700 | $65,700 | $167,000 |
| 2016 | $3,315 | $220,200 | $62,500 | $157,700 |
| 2015 | $2,896 | $195,039 | $55,281 | $139,758 |
| 2014 | -- | $179,779 | $50,837 | $128,942 |
| 2013 | -- | $156,998 | $44,580 | $112,418 |
Source: Public Records
Map
Nearby Homes
- 540 Tamarack Trail Unit 406
- 274 Tamarack Trail Unit 805
- xxx 200th St W
- 3667 205th St W
- 3370 201st St W
- 21115 Cameron Way
- 20020 Cabrilla Way
- 20941 Chippendale Ave W
- 21020 Chippendale Ct
- 3060 212th St W
- 19917 Butternut Trail
- 1309 Prairie View Trail
- 25 Willow Way
- 1200 Willow Trail
- 803 Pine St
- 36 Pine Place
- 1124 Bristol Ln
- 201 12th St
- 20155 Biscayne Ave W
- 19722 Cabrilla Way
- 20552 Camden Path
- 20548 Camden Path
- 3210 Vermillion River Trail
- 20556 Camden Path
- 20546 Camden Path
- 20551 Camden Path
- 20547 Camden Path
- 20558 Camden Path
- 20542 Camden Path
- 20557 Camden Path
- 3186 Vermillion River Trail
- 3170 Vermillion River Trail
- 20541 Camden Path
- 20560 Camden Path
- 20563 Camden Path
- 20500 Camden Path
- 20539 Camden Ct
- 3245 Vermillion River Trail
- 20564 Camden Path
- 20537 Camden Ct