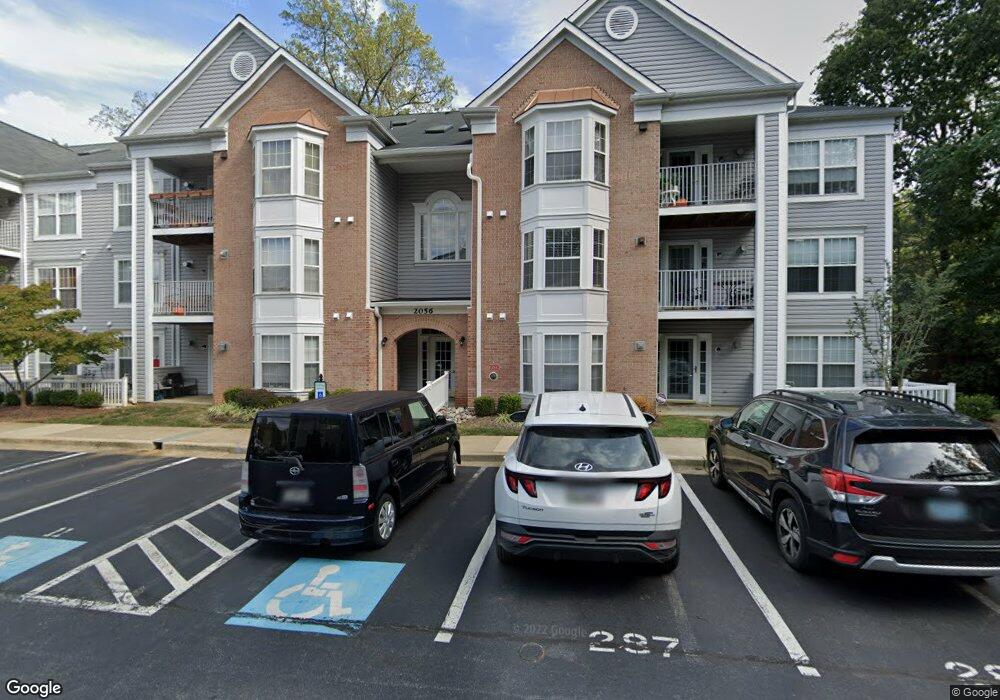
2056 Quaker Way Unit 11 Annapolis, MD 21401
Parole NeighborhoodEstimated Value: $364,000 - $398,000
--
Bed
2
Baths
1,454
Sq Ft
$258/Sq Ft
Est. Value
About This Home
This home is located at 2056 Quaker Way Unit 11, Annapolis, MD 21401 and is currently estimated at $374,526, approximately $257 per square foot. 2056 Quaker Way Unit 11 is a home located in Anne Arundel County with nearby schools including West Annapolis Elementary School, Wiley H. Bates Middle School, and Annapolis High School.
Ownership History
Date
Name
Owned For
Owner Type
Purchase Details
Closed on
Oct 12, 2005
Sold by
Webb Dawn K
Bought by
Esposito Jennifer A
Current Estimated Value
Home Financials for this Owner
Home Financials are based on the most recent Mortgage that was taken out on this home.
Original Mortgage
$252,000
Outstanding Balance
$135,307
Interest Rate
5.81%
Mortgage Type
New Conventional
Estimated Equity
$239,219
Purchase Details
Closed on
Sep 23, 2005
Sold by
Webb Dawn K
Bought by
Esposito Jennifer A
Home Financials for this Owner
Home Financials are based on the most recent Mortgage that was taken out on this home.
Original Mortgage
$252,000
Outstanding Balance
$135,307
Interest Rate
5.81%
Mortgage Type
New Conventional
Estimated Equity
$239,219
Purchase Details
Closed on
Mar 19, 1998
Sold by
Collaborative Relocation
Bought by
Webb Dawn K
Purchase Details
Closed on
Feb 3, 1997
Sold by
Pulte Home Corporation
Bought by
Montgomery Sharen Morya
Create a Home Valuation Report for This Property
The Home Valuation Report is an in-depth analysis detailing your home's value as well as a comparison with similar homes in the area
Home Values in the Area
Average Home Value in this Area
Purchase History
| Date | Buyer | Sale Price | Title Company |
|---|---|---|---|
| Esposito Jennifer A | $315,000 | -- | |
| Esposito Jennifer A | $315,000 | -- | |
| Webb Dawn K | $113,000 | -- | |
| Collaborative Relocation | $113,000 | -- | |
| Montgomery Sharen Morya | $115,000 | -- |
Source: Public Records
Mortgage History
| Date | Status | Borrower | Loan Amount |
|---|---|---|---|
| Open | Esposito Jennifer A | $252,000 | |
| Closed | Esposito Jennifer A | $252,000 | |
| Closed | Montgomery Sharen Morya | -- |
Source: Public Records
Tax History Compared to Growth
Tax History
| Year | Tax Paid | Tax Assessment Tax Assessment Total Assessment is a certain percentage of the fair market value that is determined by local assessors to be the total taxable value of land and additions on the property. | Land | Improvement |
|---|---|---|---|---|
| 2025 | $2,922 | $290,800 | $145,400 | $145,400 |
| 2024 | $2,922 | $281,100 | $0 | $0 |
| 2023 | $2,852 | $271,400 | $0 | $0 |
| 2022 | $2,735 | $261,700 | $130,800 | $130,900 |
| 2021 | $2,566 | $254,433 | $0 | $0 |
| 2020 | $2,566 | $247,167 | $0 | $0 |
| 2019 | $2,516 | $239,900 | $119,900 | $120,000 |
| 2018 | $2,383 | $235,033 | $0 | $0 |
| 2017 | $2,324 | $230,167 | $0 | $0 |
| 2016 | -- | $225,300 | $0 | $0 |
| 2015 | -- | $225,300 | $0 | $0 |
| 2014 | -- | $225,300 | $0 | $0 |
Source: Public Records
Map
Nearby Homes
- 2013 Warners Terrace S Unit 348
- 2026 Gov Thomas Bladen Way Unit 102
- 2020 Puritan Terrace
- 2000 Phillips Terrace Unit 4
- 668 N Bestgate Rd
- 2075 Old Admiral Ct
- 4 Roosevelt Dr
- 228 Dubois Rd
- 341 Dubois Rd
- 343 Dubois Rd
- 629 Admiral Dr Unit H8-305
- 173 Williams Dr
- 2155 Scotts Crossing Ct Unit 303
- 1974 Scotts Crossing Way
- 349 Dewey Dr
- 29 Collison Rd
- 1860 Lindamoor Ln
- 201 Bowie Ave
- 1715 Porters Hill Rd
- 411 Ridgely Ave
- 2056 Quaker Way Unit 4
- 2056 Quaker Way Unit 13
- 2056 Quaker Way Unit 5
- 2056 Quaker Way Unit 10
- 2056 Quaker Way Unit 14
- 2056 Quaker Way Unit 9
- 2056 Quaker Way Unit 1
- 2056 Quaker Way Unit 2
- 2056 Quaker Way Unit 8
- 2056 Quaker Way Unit 6
- 2056 Quaker Way Unit 12
- 2056 Quaker Way Unit 3
- 2056 Quaker Way Unit 7
- 2056 Quaker Way Unit 206
- 2054 Quaker Way Unit 13
- 2054 Quaker Way Unit 11
- 2054 Quaker Way
- 2054 Quaker Way Unit 12
- 2054 Quaker Way Unit 2
- 2054 Quaker Way Unit 9