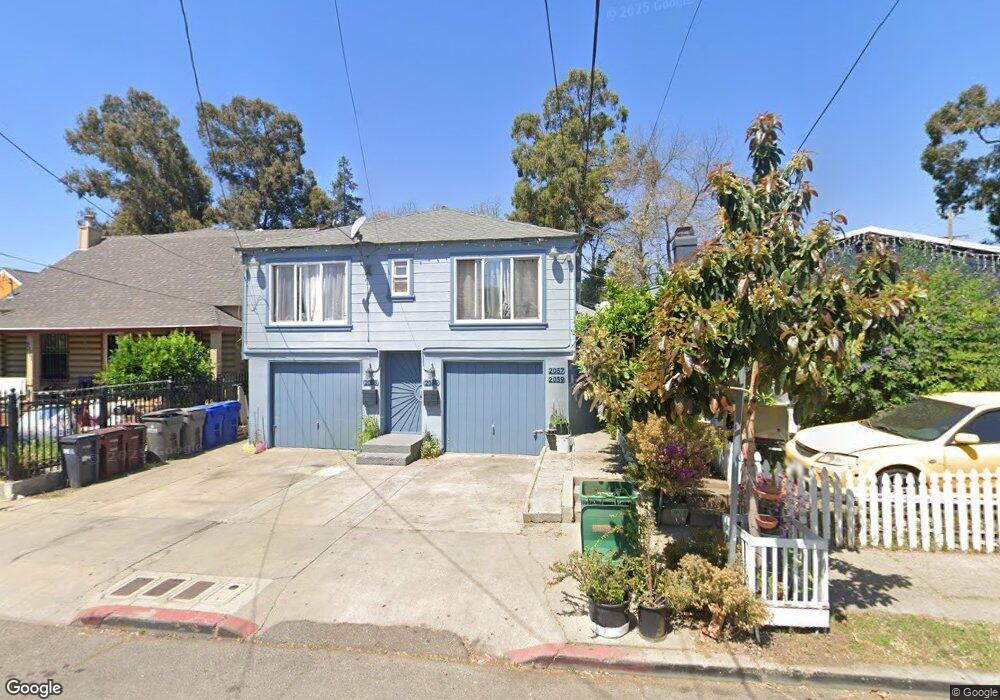
2059 Austin St Oakland, CA 94601
Sausal Creek NeighborhoodEstimated Value: $576,918 - $804,000
5
Beds
4
Baths
2,614
Sq Ft
$268/Sq Ft
Est. Value
About This Home
This home is located at 2059 Austin St, Oakland, CA 94601 and is currently estimated at $700,480, approximately $267 per square foot. 2059 Austin St is a home located in Alameda County with nearby schools including Manzanita Community School, Manzanita Seed Elementary School, and Urban Promise Academy.
Ownership History
Date
Name
Owned For
Owner Type
Purchase Details
Closed on
Aug 30, 2007
Sold by
Cabrera Adelina
Bought by
Cabrera Ignacio and Cabrera Adelina
Current Estimated Value
Purchase Details
Closed on
Aug 5, 2004
Sold by
Cabrera Ignacio
Bought by
Cabrera Adelina
Home Financials for this Owner
Home Financials are based on the most recent Mortgage that was taken out on this home.
Original Mortgage
$480,000
Outstanding Balance
$235,969
Interest Rate
5.87%
Mortgage Type
New Conventional
Estimated Equity
$464,511
Purchase Details
Closed on
Feb 6, 2004
Sold by
Vardanega Robert and Granite Creek Properties
Bought by
Cabrera Ignacio and Cabrera Adelina
Home Financials for this Owner
Home Financials are based on the most recent Mortgage that was taken out on this home.
Original Mortgage
$400,000
Interest Rate
7.87%
Mortgage Type
Purchase Money Mortgage
Purchase Details
Closed on
Oct 5, 1999
Sold by
Xu Mei Na
Bought by
Vardanega Robert
Create a Home Valuation Report for This Property
The Home Valuation Report is an in-depth analysis detailing your home's value as well as a comparison with similar homes in the area
Home Values in the Area
Average Home Value in this Area
Purchase History
| Date | Buyer | Sale Price | Title Company |
|---|---|---|---|
| Cabrera Ignacio | -- | None Available | |
| Cabrera Adelina | -- | Fidelity National Title Waln | |
| Cabrera Ignacio | $500,000 | Financial Title Company | |
| Vardanega Robert | -- | Chicago Title Co | |
| Vardanega Robert | $137,000 | Chicago Title Co |
Source: Public Records
Mortgage History
| Date | Status | Borrower | Loan Amount |
|---|---|---|---|
| Open | Cabrera Adelina | $480,000 | |
| Closed | Cabrera Ignacio | $400,000 | |
| Closed | Cabrera Ignacio | $50,000 |
Source: Public Records
Tax History Compared to Growth
Tax History
| Year | Tax Paid | Tax Assessment Tax Assessment Total Assessment is a certain percentage of the fair market value that is determined by local assessors to be the total taxable value of land and additions on the property. | Land | Improvement |
|---|---|---|---|---|
| 2025 | $12,786 | $717,963 | $215,389 | $502,574 |
| 2024 | $12,786 | $703,888 | $211,166 | $492,722 |
| 2023 | $13,253 | $690,087 | $207,026 | $483,061 |
| 2022 | $12,670 | $676,558 | $202,967 | $473,591 |
| 2021 | $11,768 | $663,297 | $198,989 | $464,308 |
| 2020 | $11,644 | $656,500 | $196,950 | $459,550 |
| 2019 | $10,991 | $643,627 | $193,088 | $450,539 |
| 2018 | $10,756 | $631,007 | $189,302 | $441,705 |
| 2017 | $10,243 | $618,634 | $185,590 | $433,044 |
| 2016 | $9,168 | $550,000 | $165,000 | $385,000 |
| 2015 | $7,861 | $450,000 | $135,000 | $315,000 |
| 2014 | $7,194 | $375,000 | $112,500 | $262,500 |
Source: Public Records
Map
Nearby Homes
- 2918 Foothill Blvd
- 2011 Rutherford St
- 2816 Foothill Blvd
- 2140 27th Ave
- 3020 E 19th St
- 3243 E 23rd St
- 2004 27th Ave
- 2021 27th Ave
- 2017 27th Ave
- 2430 27th Ave
- 2510 E 21st St
- 2025 34th Ave
- 1945 26th Ave
- 2520 E 24th St
- 3251 Hyde St
- 3300 E 17th St
- 2486 26th Ave
- 2749 E 17th St
- 1656 33rd Ave
- 3311 E 17th St
- 2063 Austin St
- 2051 Austin St
- 2041 Austin St
- 2779 E 22nd St
- 2035 Austin St
- 2033 Austin St
- 2903 E 22nd St
- 2780 E 22nd St
- 2767 E 22nd St
- 2025 Austin St
- 2898 E 22nd St
- 2909 E 22nd St
- 2044 Austin St
- 2900 E 22nd St
- 2021 Austin St
- 2902 E 22nd St
- 2915 E 22nd St
- 2034 Austin St
- 2130 Mitchell St
- 2806 E 21st St