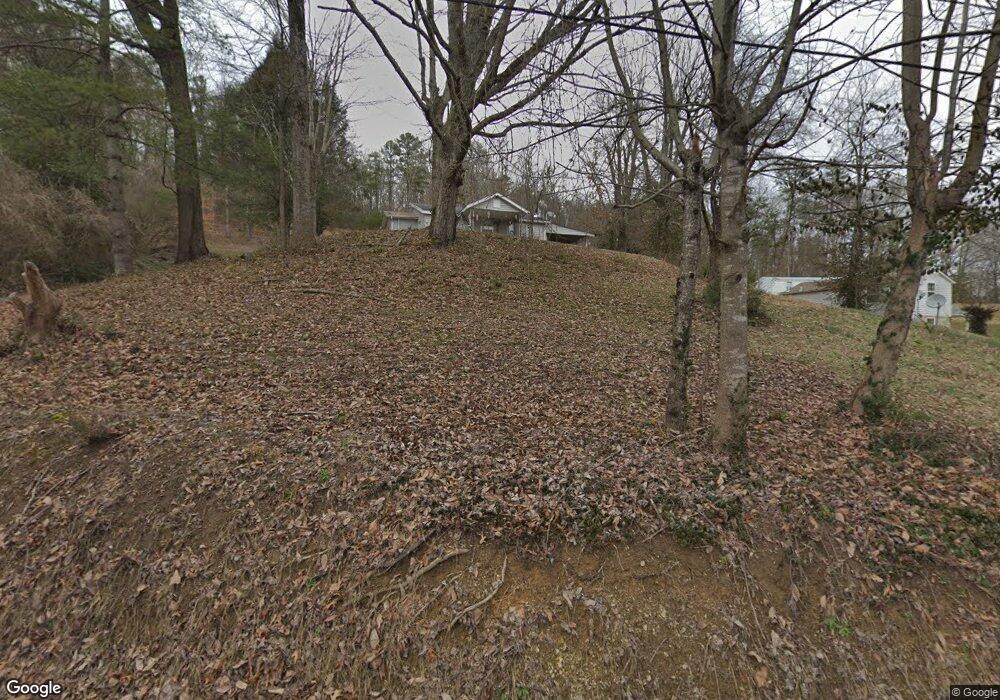
206 Maples Rd Knoxville, TN 37920
Estimated Value: $152,000 - $279,000
--
Bed
1
Bath
812
Sq Ft
$284/Sq Ft
Est. Value
About This Home
This home is located at 206 Maples Rd, Knoxville, TN 37920 and is currently estimated at $230,734, approximately $284 per square foot. 206 Maples Rd is a home located in Blount County with nearby schools including Prospect Elementary School, Heritage Middle School, and Heritage High School.
Ownership History
Date
Name
Owned For
Owner Type
Purchase Details
Closed on
Dec 11, 2007
Sold by
Kitts Jeffrey Thomas
Bought by
Whitted Jack W
Current Estimated Value
Purchase Details
Closed on
Jul 5, 2005
Sold by
Tennessee Housing Developm
Bought by
Kitts Jefftey T
Purchase Details
Closed on
Jun 21, 2005
Sold by
Tennessee Housing
Bought by
Kitts Jeffrey Thomas
Purchase Details
Closed on
Dec 15, 2004
Bought by
Tennessee Housing
Purchase Details
Closed on
Aug 25, 1999
Sold by
Cook Jesse
Bought by
Buckridge Troy
Home Financials for this Owner
Home Financials are based on the most recent Mortgage that was taken out on this home.
Original Mortgage
$93,000
Interest Rate
7.5%
Purchase Details
Closed on
Jan 22, 1999
Sold by
Scarlett William E
Bought by
Cook Jesse
Purchase Details
Closed on
Jan 1, 1985
Bought by
Scarlett William E and Scarlett Nancy L
Create a Home Valuation Report for This Property
The Home Valuation Report is an in-depth analysis detailing your home's value as well as a comparison with similar homes in the area
Home Values in the Area
Average Home Value in this Area
Purchase History
| Date | Buyer | Sale Price | Title Company |
|---|---|---|---|
| Whitted Jack W | $35,000 | -- | |
| Kitts Jefftey T | $22,650 | -- | |
| Kitts Jeffrey Thomas | $22,650 | -- | |
| Tennessee Housing | $24,891 | -- | |
| Buckridge Troy | $95,000 | -- | |
| Cook Jesse | $10,000 | -- | |
| Scarlett William E | $31,000 | -- |
Source: Public Records
Mortgage History
| Date | Status | Borrower | Loan Amount |
|---|---|---|---|
| Previous Owner | Scarlett William E | $93,000 |
Source: Public Records
Tax History Compared to Growth
Tax History
| Year | Tax Paid | Tax Assessment Tax Assessment Total Assessment is a certain percentage of the fair market value that is determined by local assessors to be the total taxable value of land and additions on the property. | Land | Improvement |
|---|---|---|---|---|
| 2025 | $1,067 | $67,120 | $0 | $0 |
| 2024 | $1,067 | $67,120 | $28,640 | $38,480 |
| 2023 | $1,067 | $67,120 | $28,640 | $38,480 |
| 2022 | $921 | $37,280 | $17,200 | $20,080 |
| 2021 | $921 | $37,280 | $17,200 | $20,080 |
| 2020 | $921 | $37,280 | $17,200 | $20,080 |
| 2019 | $921 | $37,280 | $17,200 | $20,080 |
| 2018 | $497 | $20,125 | $10,750 | $9,375 |
| 2017 | $497 | $20,125 | $10,750 | $9,375 |
| 2016 | $497 | $20,125 | $10,750 | $9,375 |
| 2015 | $433 | $20,125 | $10,750 | $9,375 |
| 2014 | $438 | $20,125 | $10,750 | $9,375 |
| 2013 | $438 | $20,375 | $0 | $0 |
Source: Public Records
Map
Nearby Homes
- 10023 Chapman Hwy
- The Marigold Plan at Chapman Trace
- The Lily Plan at Chapman Trace
- 8851 Chapman Trace Way
- 8849 Chapman Trace Way
- 9115 Chapman Hwy Unit A
- 8847 Chapman Trace Way
- 8852 Chapman Trace Way
- 8845 Chapman Trace Way
- 8848 Chapman Trace Way
- 8846 Chapman Trace Way
- 8840 Chapman Trace Way
- 8838 Chapman Trace Way
- 8827 Chapman Trace Way
- 8825 Chapman Trace Way
- 8823 Chapman Trace Way
- 204 Joy St
- 8710 Chapman Trace Way
- 8708 Chapman Trace Way
- 8706 Chapman Trace Way