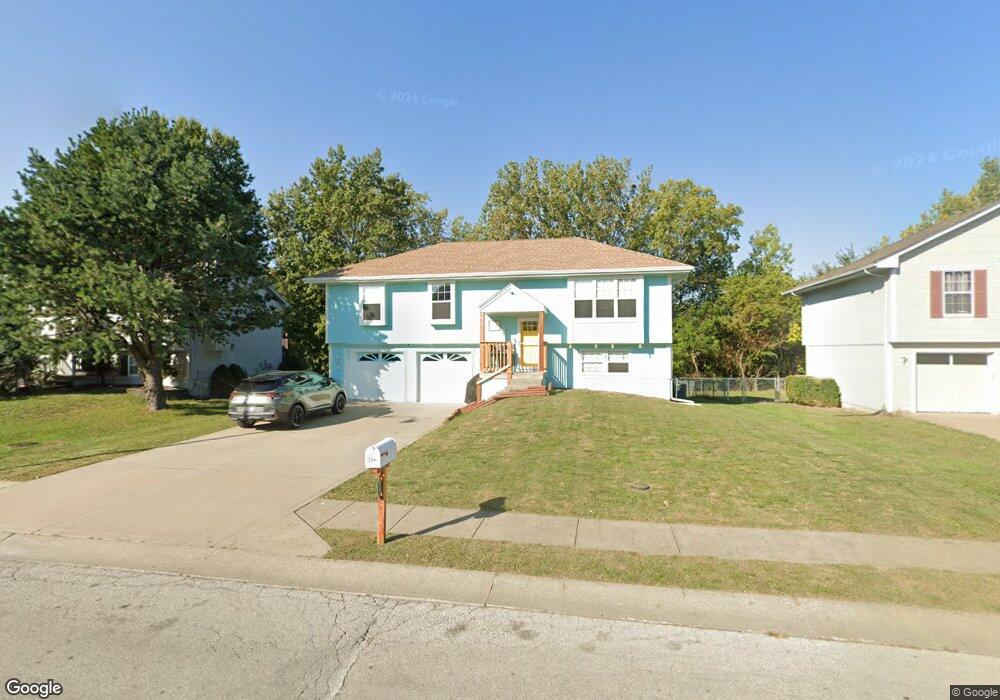
206 S Huntsman Blvd Raymore, MO 64083
Estimated Value: $278,031 - $295,000
3
Beds
2
Baths
1,163
Sq Ft
$246/Sq Ft
Est. Value
About This Home
This home is located at 206 S Huntsman Blvd, Raymore, MO 64083 and is currently estimated at $286,258, approximately $246 per square foot. 206 S Huntsman Blvd is a home located in Cass County with nearby schools including Eagle Glen Intermediate School, Raymore-Peculiar East Middle School, and Raymore-Peculiar Senior High School.
Ownership History
Date
Name
Owned For
Owner Type
Purchase Details
Closed on
Apr 22, 2010
Sold by
Secretary Of Hud
Bought by
Ramirez Kristopher E
Current Estimated Value
Home Financials for this Owner
Home Financials are based on the most recent Mortgage that was taken out on this home.
Original Mortgage
$104,000
Outstanding Balance
$68,688
Interest Rate
4.91%
Mortgage Type
New Conventional
Estimated Equity
$217,570
Purchase Details
Closed on
Jan 4, 2010
Sold by
Citimortgage Inc
Bought by
Secretary Of Hud
Purchase Details
Closed on
Dec 21, 2009
Sold by
Olawaiye Christopher K and Olawaiye Iyabo D
Bought by
Citimortgage Inc
Purchase Details
Closed on
Aug 3, 2005
Sold by
Jurgensmeyer Tyler and Jurgensmeyer Stacey
Bought by
Olawaiye Christopher K and Olawaiye Iyabo D
Home Financials for this Owner
Home Financials are based on the most recent Mortgage that was taken out on this home.
Original Mortgage
$136,918
Interest Rate
5.55%
Mortgage Type
FHA
Create a Home Valuation Report for This Property
The Home Valuation Report is an in-depth analysis detailing your home's value as well as a comparison with similar homes in the area
Home Values in the Area
Average Home Value in this Area
Purchase History
| Date | Buyer | Sale Price | Title Company |
|---|---|---|---|
| Ramirez Kristopher E | -- | -- | |
| Secretary Of Hud | -- | -- | |
| Citimortgage Inc | -- | None Available | |
| Olawaiye Christopher K | -- | -- |
Source: Public Records
Mortgage History
| Date | Status | Borrower | Loan Amount |
|---|---|---|---|
| Open | Ramirez Kristopher E | $104,000 | |
| Previous Owner | Olawaiye Christopher K | $136,918 |
Source: Public Records
Tax History Compared to Growth
Tax History
| Year | Tax Paid | Tax Assessment Tax Assessment Total Assessment is a certain percentage of the fair market value that is determined by local assessors to be the total taxable value of land and additions on the property. | Land | Improvement |
|---|---|---|---|---|
| 2025 | $2,216 | $30,450 | $5,050 | $25,400 |
| 2024 | $2,216 | $27,230 | $4,590 | $22,640 |
| 2023 | $2,213 | $27,230 | $4,590 | $22,640 |
| 2022 | $1,941 | $23,730 | $4,590 | $19,140 |
| 2021 | $1,942 | $23,730 | $4,590 | $19,140 |
| 2020 | $1,911 | $22,940 | $4,590 | $18,350 |
| 2019 | $1,845 | $22,940 | $4,590 | $18,350 |
| 2018 | $1,705 | $20,480 | $3,860 | $16,620 |
| 2017 | $1,564 | $20,480 | $3,860 | $16,620 |
| 2016 | $1,564 | $19,500 | $3,860 | $15,640 |
| 2015 | $1,565 | $19,500 | $3,860 | $15,640 |
| 2014 | $1,566 | $19,500 | $3,860 | $15,640 |
| 2013 | -- | $19,500 | $3,860 | $15,640 |
Source: Public Records
Map
Nearby Homes
- 212 S Huntsman Blvd
- 1706 Johnston Dr
- 224 S Huntsman Blvd
- 123 S Darrowby Dr
- 1703 Shelby Dr
- 1705 W Pelham Path
- 104 N Darrowby Dr
- 400 Meadowlark Dr
- 338 Meadowlark Dr
- 402 Woodview Dr
- 1517 Johnston Dr
- Heather Plan at Timber Trails
- Carbondale - Limited Availability Plan at Timber Trails
- Sunflower Plan at Timber Trails
- Westport - Limited Availability Plan at Timber Trails
- 408 Woodview Dr
- Winfield Plan at Timber Trails
- Somerset Plan at Timber Trails
- Marmalade - Limited Availability Plan at Timber Trails
- Basswood Plan at Timber Trails
- 208 S Huntsman Blvd
- 204 S Huntsman Blvd
- 202 S Huntsman Blvd
- 207 S Darrowby Dr
- 209 S Darrowby Dr
- 1710 Stasi Ave
- 205 S Darrowby Dr
- 1711 Stasi Ave
- 211 S Darrowby Dr
- 203 S Darrowby Dr
- 1711 W Christi Ln
- 1709 Stasi Ave
- 213 S Darrowby Dr
- 214 S Huntsman Blvd
- 201 S Darrowby Dr
- 1710 Johnston Dr
- 122 S Huntsman Blvd
- 1709 W Christi Ln
- 1706 Stasi Ave
- 1707 Stasi Ave