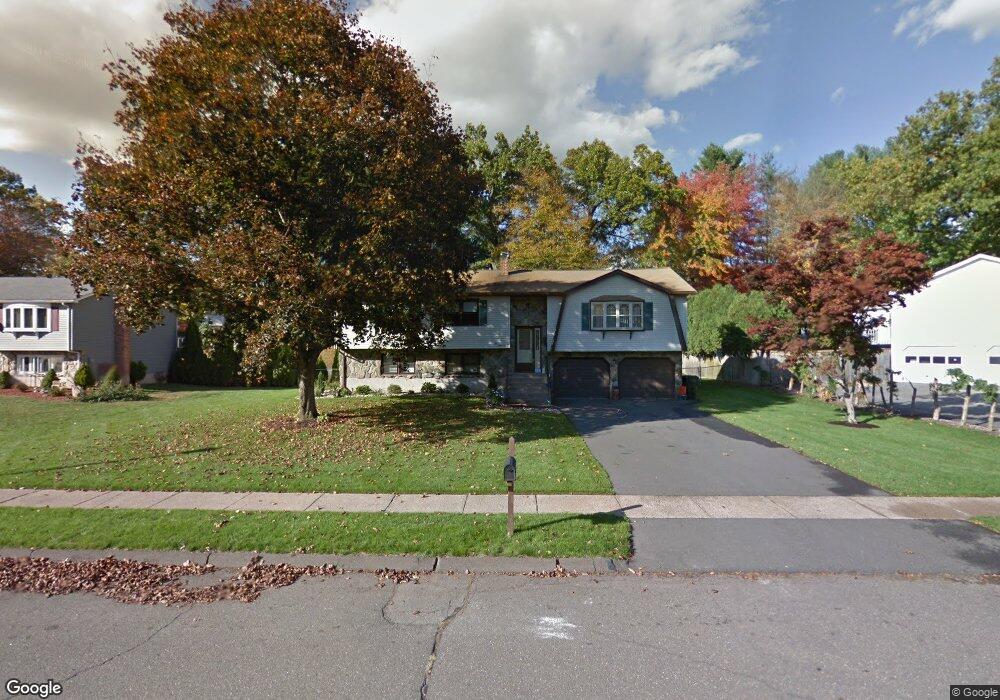
206 Woodmont Dr East Hartford, CT 06118
Estimated Value: $390,000 - $432,000
3
Beds
3
Baths
1,646
Sq Ft
$253/Sq Ft
Est. Value
About This Home
This home is located at 206 Woodmont Dr, East Hartford, CT 06118 and is currently estimated at $417,195, approximately $253 per square foot. 206 Woodmont Dr is a home located in Hartford County with nearby schools including Ocotillo Elementary School, Dr. Thomas S. O'Connell School, and East Hartford Middle School.
Ownership History
Date
Name
Owned For
Owner Type
Purchase Details
Closed on
Jun 19, 2023
Sold by
Scheiblich John J
Bought by
Bartlett Melissa A and Scheiblich John J
Current Estimated Value
Purchase Details
Closed on
Apr 10, 2018
Sold by
Spell Sean
Bought by
Scheiblich John
Home Financials for this Owner
Home Financials are based on the most recent Mortgage that was taken out on this home.
Original Mortgage
$248,320
Interest Rate
4.4%
Mortgage Type
New Conventional
Purchase Details
Closed on
Dec 1, 2004
Sold by
Blanco Frances J and Blanco Nilda I
Bought by
Spell Sean C
Purchase Details
Closed on
Dec 18, 2002
Sold by
Walz Fred C and Walz Barbara N
Bought by
Blanco Francis J and Torres Nilda I
Create a Home Valuation Report for This Property
The Home Valuation Report is an in-depth analysis detailing your home's value as well as a comparison with similar homes in the area
Home Values in the Area
Average Home Value in this Area
Purchase History
| Date | Buyer | Sale Price | Title Company |
|---|---|---|---|
| Bartlett Melissa A | -- | None Available | |
| Scheiblich John | $256,000 | -- | |
| Spell Sean C | $257,000 | -- | |
| Blanco Francis J | $211,000 | -- |
Source: Public Records
Mortgage History
| Date | Status | Borrower | Loan Amount |
|---|---|---|---|
| Previous Owner | Blanco Francis J | $248,320 | |
| Previous Owner | Blanco Francis J | $173,000 | |
| Previous Owner | Blanco Francis J | $27,000 | |
| Previous Owner | Blanco Francis J | $50,000 |
Source: Public Records
Tax History Compared to Growth
Tax History
| Year | Tax Paid | Tax Assessment Tax Assessment Total Assessment is a certain percentage of the fair market value that is determined by local assessors to be the total taxable value of land and additions on the property. | Land | Improvement |
|---|---|---|---|---|
| 2025 | $9,505 | $207,070 | $49,890 | $157,180 |
| 2024 | $9,111 | $207,070 | $49,890 | $157,180 |
| 2023 | $8,809 | $207,070 | $49,890 | $157,180 |
| 2022 | $8,490 | $207,070 | $49,890 | $157,180 |
| 2021 | $7,885 | $159,770 | $37,790 | $121,980 |
| 2020 | $7,976 | $159,770 | $37,790 | $121,980 |
| 2019 | $7,846 | $159,770 | $37,790 | $121,980 |
| 2018 | $7,615 | $159,770 | $37,790 | $121,980 |
| 2017 | $7,517 | $159,770 | $37,790 | $121,980 |
| 2016 | $7,453 | $162,520 | $37,790 | $124,730 |
| 2015 | $7,453 | $162,520 | $37,790 | $124,730 |
| 2014 | $7,378 | $162,520 | $37,790 | $124,730 |
Source: Public Records
Map
Nearby Homes
- 180 Woodmont Dr
- 252 Woodmont Dr
- 288 Oconnell Dr
- 133 Shelley Ln
- 15 Lancaster Rd
- 8 Butternut Dr
- 17 Garland Dr
- 5 Garland Dr
- 45 Brookfield Dr
- 19 Stonecress Ln
- 3 Periwinkle Ln
- 13 Holly Ln Unit 13
- 95 Hills St
- 33 Spruce Dr
- 27 Heron Rd
- 131 Country Ln
- 33 April Dr
- 115 Greenwood St
- 269 House St
- 70 Green Manor Dr
- 212 Woodmont Dr
- 205 Woodmont Dr
- 211 Woodmont Dr
- 198 Woodmont Dr
- 217 Oconnell Dr
- 224 Woodmont Dr
- 223 Oconnell Dr
- 211 Oconnell Dr
- 191 Woodmont Dr
- 229 Woodmont Dr
- 190 Woodmont Dr
- 199 Woodmont Dr
- 205 Oconnell Dr
- 231 Woodmont Dr
- 236 Woodmont Dr
- 233 Oconnell Dr
- 199 Oconnell Dr
- 244 Woodmont Dr
- 193 Oconnell Dr
- 239 Oconnell Dr