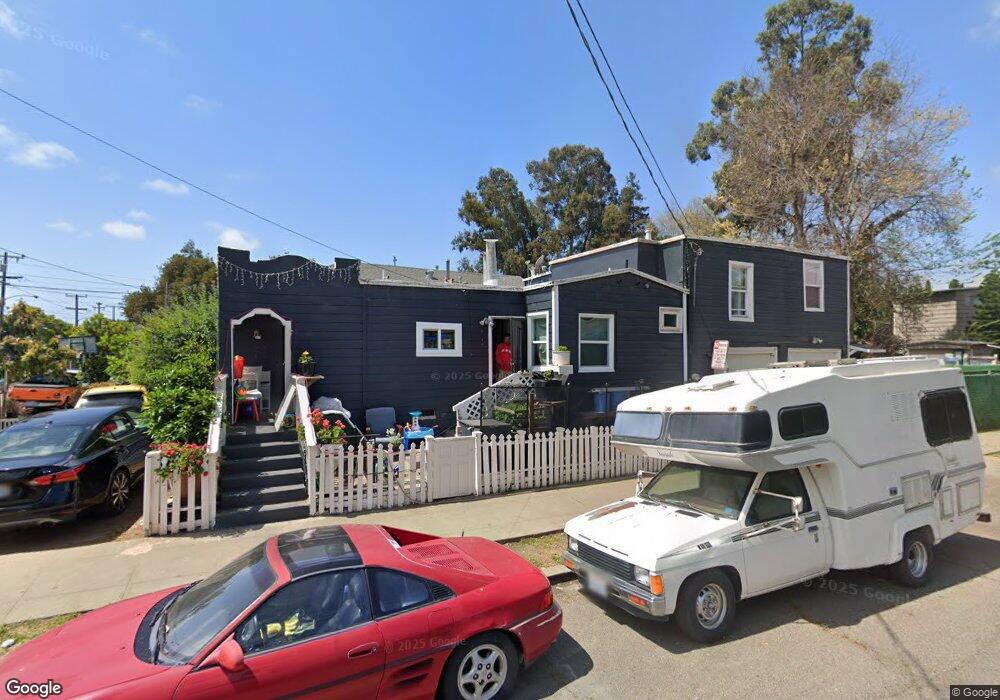
2063 Austin St Oakland, CA 94601
Sausal Creek NeighborhoodEstimated Value: $498,243 - $587,000
7
Beds
4
Baths
1,184
Sq Ft
$457/Sq Ft
Est. Value
About This Home
This home is located at 2063 Austin St, Oakland, CA 94601 and is currently estimated at $541,561, approximately $457 per square foot. 2063 Austin St is a home located in Alameda County with nearby schools including Manzanita Community School, Manzanita Seed Elementary School, and Urban Promise Academy.
Ownership History
Date
Name
Owned For
Owner Type
Purchase Details
Closed on
Jan 18, 2022
Sold by
Prata Da Cruz Nuno Maria
Bought by
2008 Nuno Mp Da Cruz And Maria Da Cruz Revoca and Cruz Maria
Current Estimated Value
Purchase Details
Closed on
Jan 10, 2022
Sold by
Cruz 2008 Nuno Mp Da and Cruz Maria R
Bought by
2008 Nuno Mp Da Cruz And Maria Da Cruz Revoca and Cruz Maria
Purchase Details
Closed on
Dec 23, 2008
Sold by
Nuno Da Cruz Nuno M P and Nuno Da Cruz
Bought by
Da Cruz Nuno M P P and 2008 Nuno M P
Purchase Details
Closed on
Apr 12, 1994
Sold by
The Foreclosure Company
Bought by
Swinford Philip A
Create a Home Valuation Report for This Property
The Home Valuation Report is an in-depth analysis detailing your home's value as well as a comparison with similar homes in the area
Home Values in the Area
Average Home Value in this Area
Purchase History
| Date | Buyer | Sale Price | Title Company |
|---|---|---|---|
| 2008 Nuno Mp Da Cruz And Maria Da Cruz Revoca | -- | -- | |
| 2008 Nuno Mp Da Cruz And Maria Da Cruz Revoca | -- | Law Office Of James D Krupka | |
| 2008 Nuno Mp Da Cruz And Maria Da Cruz Revoca | -- | -- | |
| Da Cruz Nuno M P P | -- | None Available | |
| Swinford Philip A | $109,765 | -- |
Source: Public Records
Tax History Compared to Growth
Tax History
| Year | Tax Paid | Tax Assessment Tax Assessment Total Assessment is a certain percentage of the fair market value that is determined by local assessors to be the total taxable value of land and additions on the property. | Land | Improvement |
|---|---|---|---|---|
| 2025 | $3,131 | $103,822 | $37,376 | $66,446 |
| 2024 | $3,131 | $101,786 | $36,643 | $65,143 |
| 2023 | $3,167 | $99,790 | $35,924 | $63,866 |
| 2022 | $3,015 | $97,834 | $35,220 | $62,614 |
| 2021 | $2,734 | $95,916 | $34,530 | $61,386 |
| 2020 | $2,702 | $94,933 | $34,176 | $60,757 |
| 2019 | $2,507 | $93,072 | $33,506 | $59,566 |
| 2018 | $2,459 | $91,247 | $32,849 | $58,398 |
| 2017 | $2,331 | $89,459 | $32,205 | $57,254 |
| 2016 | $2,165 | $87,705 | $31,574 | $56,131 |
| 2015 | $2,149 | $86,387 | $31,099 | $55,288 |
| 2014 | $2,063 | $84,696 | $30,490 | $54,206 |
Source: Public Records
Map
Nearby Homes