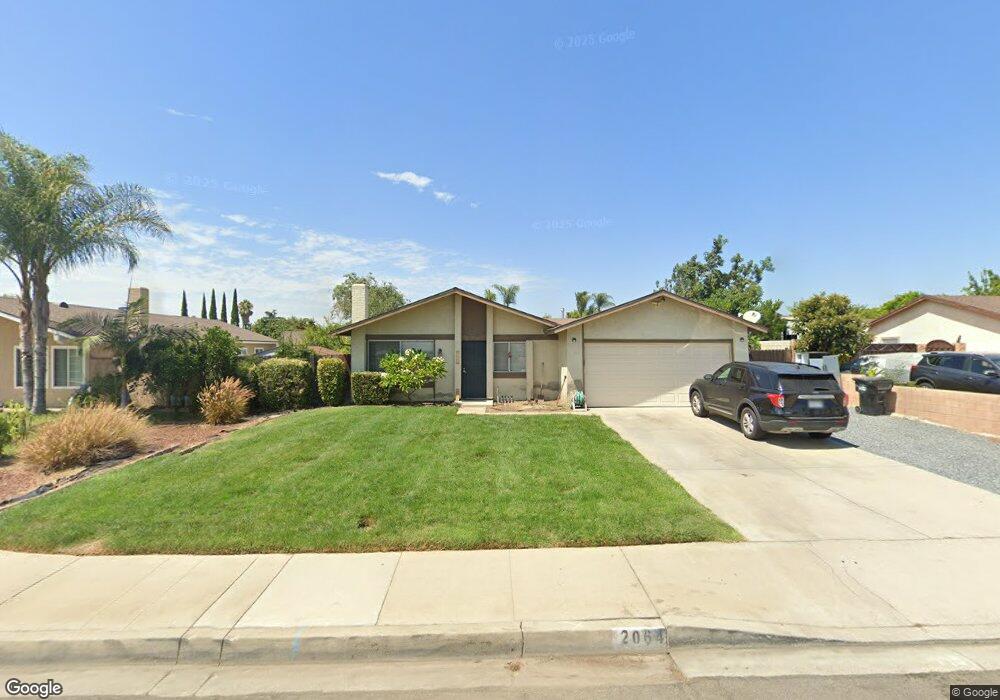
2064 S Sultana Ave Ontario, CA 91761
Downtown Ontario NeighborhoodEstimated Value: $630,511 - $683,000
3
Beds
2
Baths
1,125
Sq Ft
$588/Sq Ft
Est. Value
About This Home
This home is located at 2064 S Sultana Ave, Ontario, CA 91761 and is currently estimated at $661,628, approximately $588 per square foot. 2064 S Sultana Ave is a home located in San Bernardino County with nearby schools including Sultana Elementary School, De Anza Middle, and Ontario High School.
Ownership History
Date
Name
Owned For
Owner Type
Purchase Details
Closed on
Oct 16, 2021
Sold by
Frazier Robert Lee and Frazier Susan Lee
Bought by
2064 Sultana Llc
Current Estimated Value
Purchase Details
Closed on
Jan 3, 2018
Sold by
Irby Alice
Bought by
Frazier Susan L and Irby Susan L
Purchase Details
Closed on
Nov 30, 2017
Sold by
Irby Kenneth Carl
Bought by
Irby Susan L and Irby Alice
Create a Home Valuation Report for This Property
The Home Valuation Report is an in-depth analysis detailing your home's value as well as a comparison with similar homes in the area
Home Values in the Area
Average Home Value in this Area
Purchase History
| Date | Buyer | Sale Price | Title Company |
|---|---|---|---|
| 2064 Sultana Llc | -- | None Available | |
| Frazier Robert Lee | -- | None Available | |
| Frazier Susan L | -- | None Available | |
| Irby Susan L | -- | None Available |
Source: Public Records
Tax History Compared to Growth
Tax History
| Year | Tax Paid | Tax Assessment Tax Assessment Total Assessment is a certain percentage of the fair market value that is determined by local assessors to be the total taxable value of land and additions on the property. | Land | Improvement |
|---|---|---|---|---|
| 2025 | $1,735 | $160,028 | $34,837 | $125,191 |
| 2024 | $1,735 | $156,890 | $34,154 | $122,736 |
| 2023 | $1,687 | $153,813 | $33,484 | $120,329 |
| 2022 | $6,065 | $150,797 | $32,827 | $117,970 |
| 2021 | $1,654 | $147,831 | $32,181 | $115,650 |
| 2020 | $1,625 | $146,315 | $31,851 | $114,464 |
| 2019 | $1,611 | $143,446 | $31,226 | $112,220 |
| 2018 | $1,589 | $140,634 | $30,614 | $110,020 |
| 2017 | $1,532 | $137,877 | $30,014 | $107,863 |
| 2016 | $1,472 | $135,173 | $29,425 | $105,748 |
| 2015 | $1,462 | $133,143 | $28,983 | $104,160 |
| 2014 | $1,416 | $130,535 | $28,415 | $102,120 |
Source: Public Records
Map
Nearby Homes
- 2148 S Sultana Ave
- 304 E Cedar St
- 310 E Philadelphia St Unit 35
- 310 E Philadelphia St
- 2001 S Campus Ave Unit 7F
- 2300 S Sultana Ave Unit 298
- 2119 S Phoenix Place
- 2343 S Via Veranda Unit 10
- 2030 S Bon View Ave Unit G
- 1949 S Palm Place
- 513 E Fairfield Ct
- 2333 S Via Esplanade Unit 29
- 2333 S Via Esplanade Unit 25
- 2350 S Via Esplanade Unit 31
- 840 E Cedar St
- 1940 S Fern Ave
- 1650 S Campus Ave Unit 21
- 1650 S Campus Ave Unit 20
- 2408 S Taylor Place
- 1540 S Pleasant Ave
- 2104 S Sultana Ave
- 2056 S Sultana Ave
- 2065 S Concord Ave
- 2103 S Concord Ave
- 2057 S Concord Ave
- 2112 S Sultana Ave
- 2050 S Sultana Ave
- 2101 S Sultana Ave
- 2113 S Concord Ave
- 2051 S Concord Ave
- 503 E Boxwood Ct
- 2109 S Sultana Ave
- 2120 S Sultana Ave
- 2042 S Sultana Ave
- 2115 S Sultana Ave
- 2121 S Concord Ave
- 2043 S Concord Ave
- 509 E Boxwood Ct
- 2056 S Concord Ave
- 2102 S Concord Ave