20653 Harding Rd Mount Vernon, OH 43050
Estimated Value: $259,610 - $296,000
3
Beds
2
Baths
1,200
Sq Ft
$227/Sq Ft
Est. Value
About This Home
This home is located at 20653 Harding Rd, Mount Vernon, OH 43050 and is currently estimated at $271,903, approximately $226 per square foot. 20653 Harding Rd is a home located in Knox County with nearby schools including Mount Vernon High School.
Ownership History
Date
Name
Owned For
Owner Type
Purchase Details
Closed on
Aug 27, 2016
Sold by
Ball Heather A
Bought by
Chapin Ii Wallace J
Current Estimated Value
Purchase Details
Closed on
Aug 2, 1999
Sold by
Brasseur Terry K
Bought by
Chapin Ii Wallace J and Chapin Bal
Purchase Details
Closed on
Mar 22, 1999
Sold by
Fletcher Eddie M
Bought by
Brasseur Terry K
Purchase Details
Closed on
May 3, 1988
Sold by
Alberts David C
Bought by
Fletcher Eddie M
Create a Home Valuation Report for This Property
The Home Valuation Report is an in-depth analysis detailing your home's value as well as a comparison with similar homes in the area
Home Values in the Area
Average Home Value in this Area
Purchase History
| Date | Buyer | Sale Price | Title Company |
|---|---|---|---|
| Chapin Ii Wallace J | $1,000 | None Available | |
| Chapin Ii Wallace J | $60,000 | -- | |
| Brasseur Terry K | $50,000 | -- | |
| Fletcher Eddie M | $43,300 | -- |
Source: Public Records
Tax History Compared to Growth
Tax History
| Year | Tax Paid | Tax Assessment Tax Assessment Total Assessment is a certain percentage of the fair market value that is determined by local assessors to be the total taxable value of land and additions on the property. | Land | Improvement |
|---|---|---|---|---|
| 2024 | $2,903 | $68,040 | $14,210 | $53,830 |
| 2023 | $2,903 | $68,040 | $14,210 | $53,830 |
| 2022 | $2,172 | $46,920 | $9,800 | $37,120 |
| 2021 | $2,172 | $46,920 | $9,800 | $37,120 |
| 2020 | $2,119 | $46,920 | $9,800 | $37,120 |
| 2019 | $1,904 | $39,090 | $9,830 | $29,260 |
| 2018 | $1,905 | $39,090 | $9,830 | $29,260 |
| 2017 | $1,874 | $39,090 | $9,830 | $29,260 |
| 2016 | $1,747 | $36,200 | $9,100 | $27,100 |
| 2015 | $1,754 | $36,200 | $9,100 | $27,100 |
| 2014 | $1,762 | $36,200 | $9,100 | $27,100 |
| 2013 | $1,638 | $32,750 | $8,550 | $24,200 |
Source: Public Records
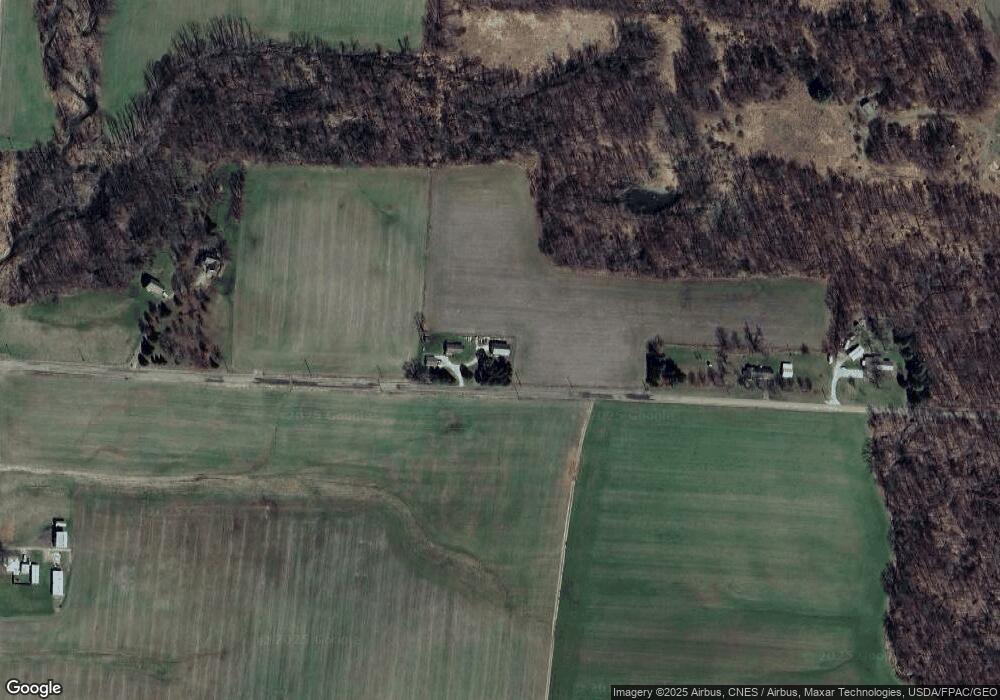
Map
Nearby Homes
- 15014 Monroe Mills Rd
- 0 Monroe Mills Rd
- 843 Country Club Dr
- 0 Greenlawn Dr Unit 225012211
- 0 Greenlawn Dr Unit 20250232
- 847 Fairway Dr
- 0 Berry Rd Unit 225024403
- 0 Berry Rd Unit 9067495
- 0 Berry Rd
- 15066 Monroe Mills Rd
- 1709 Apple Valley Dr
- 2028 Apple Valley Dr
- 2406 Apple Valley Dr
- 2422 Apple Valley Dr
- 2536 Apple Valley Dr
- 2536 Apple Valley Dr Unit Lot 298
- 2100 Apple Valley Dr Unit Lot 63
- 3142 Apple Valley Dr
- 2037 Apple Valley Dr Unit 514, 515
- 3162 Apple Valley Dr
- 20467 Harding Rd
- 20819 Harding Rd
- 20881 Harding Rd
- 14790 Gilchrist Rd
- 20990 Harding Rd
- 14841 Monroe Mills Rd
- 14021 Monroe Mills Rd
- 13961 Monroe Mills Rd
- 14538 Monroe Mills Rd
- 14446 Monroe Mills Rd
- 14732 Monroe Mills Rd
- 14794 Monroe Mills Rd
- 14864 Monroe Mills Rd
- 14878 Monroe Mills Rd
- 14919 Monroe Mills Rd
- 14900 Monroe Mills Rd
- 14474 Monroe Mills Rd
- Lot 263 Country Club Manor
- 14688 Monroe Mills Rd
- 14318 Vincent Rd