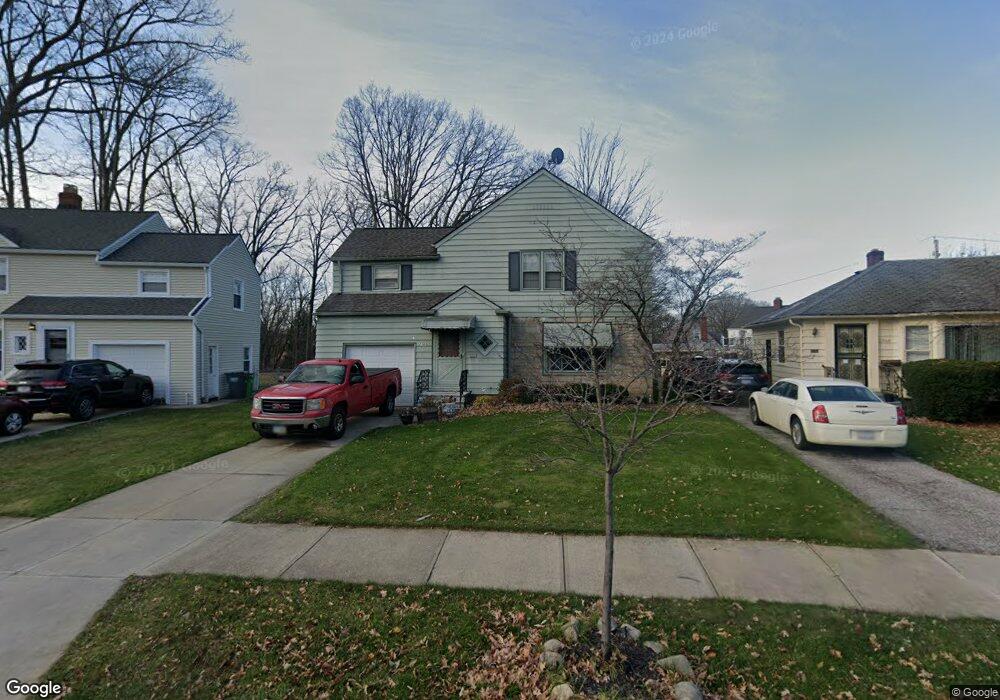
2068 Halsey Rd Cleveland, OH 44118
Estimated Value: $168,000 - $206,000
3
Beds
1
Bath
1,584
Sq Ft
$115/Sq Ft
Est. Value
About This Home
This home is located at 2068 Halsey Rd, Cleveland, OH 44118 and is currently estimated at $182,705, approximately $115 per square foot. 2068 Halsey Rd is a home located in Cuyahoga County with nearby schools including Gearity Professional Development School, Monticello Middle School, and Cleveland Heights High School.
Ownership History
Date
Name
Owned For
Owner Type
Purchase Details
Closed on
Aug 31, 1998
Sold by
Field Walter B
Bought by
Snelson Marvin L
Current Estimated Value
Home Financials for this Owner
Home Financials are based on the most recent Mortgage that was taken out on this home.
Original Mortgage
$87,210
Outstanding Balance
$18,840
Interest Rate
7.03%
Mortgage Type
VA
Estimated Equity
$163,865
Purchase Details
Closed on
Sep 9, 1985
Sold by
Robert Entis
Bought by
Field Walter B
Purchase Details
Closed on
Jul 22, 1985
Sold by
Entis Robert and Entis Margaret H
Bought by
Robert Entis
Purchase Details
Closed on
Mar 30, 1985
Sold by
Entis Louis
Bought by
Entis Robert and Entis Margaret H
Purchase Details
Closed on
Oct 21, 1983
Sold by
Entis Louis
Bought by
Entis Louis
Purchase Details
Closed on
Feb 10, 1983
Sold by
Louis Entis
Bought by
Entis Louis
Purchase Details
Closed on
Oct 8, 1980
Sold by
Entis Margaret
Bought by
Louis Entis
Purchase Details
Closed on
Jan 1, 1975
Bought by
Entis Margaret
Create a Home Valuation Report for This Property
The Home Valuation Report is an in-depth analysis detailing your home's value as well as a comparison with similar homes in the area
Home Values in the Area
Average Home Value in this Area
Purchase History
| Date | Buyer | Sale Price | Title Company |
|---|---|---|---|
| Snelson Marvin L | $85,500 | First Service Title Agency I | |
| Field Walter B | $62,000 | -- | |
| Robert Entis | $53,500 | -- | |
| Entis Robert | -- | -- | |
| Entis Louis | -- | -- | |
| Entis Louis | -- | -- | |
| Louis Entis | -- | -- | |
| Entis Margaret | -- | -- |
Source: Public Records
Mortgage History
| Date | Status | Borrower | Loan Amount |
|---|---|---|---|
| Open | Snelson Marvin L | $87,210 |
Source: Public Records
Tax History Compared to Growth
Tax History
| Year | Tax Paid | Tax Assessment Tax Assessment Total Assessment is a certain percentage of the fair market value that is determined by local assessors to be the total taxable value of land and additions on the property. | Land | Improvement |
|---|---|---|---|---|
| 2024 | $5,041 | $53,690 | $11,900 | $41,790 |
| 2023 | $4,413 | $36,550 | $8,650 | $27,900 |
| 2022 | $4,392 | $36,540 | $8,645 | $27,895 |
| 2021 | $4,314 | $36,540 | $8,650 | $27,900 |
| 2020 | $3,925 | $29,720 | $7,040 | $22,680 |
| 2019 | $3,731 | $84,900 | $20,100 | $64,800 |
| 2018 | $3,436 | $29,720 | $7,040 | $22,680 |
| 2017 | $3,394 | $24,890 | $5,570 | $19,320 |
| 2016 | $3,355 | $24,890 | $5,570 | $19,320 |
| 2015 | $3,287 | $24,890 | $5,570 | $19,320 |
| 2014 | $3,287 | $26,190 | $5,850 | $20,340 |
Source: Public Records
Map
Nearby Homes
- 13765 Cedar Rd Unit 303C
- 3809 Warrendale Rd
- 13677 Cedar Rd
- 13726 Cedar Rd
- 13805 Cedar Rd Unit 203
- 3778 E Antisdale Rd
- 3733 E Antisdale Rd
- 3631 Cummings Rd
- 2192 Barrington Rd
- 1948 Staunton Rd
- 3781 Bushnell Rd
- 13605 Cedar Rd
- 2216 Barrington Rd
- 3797 Bushnell Rd
- 3621 Cedarbrook Rd
- 2203 Brockway Rd
- 3841 Washington Blvd
- 1913 Staunton Rd
- 2227 Cranston Rd
- 2244 Edgerton Rd