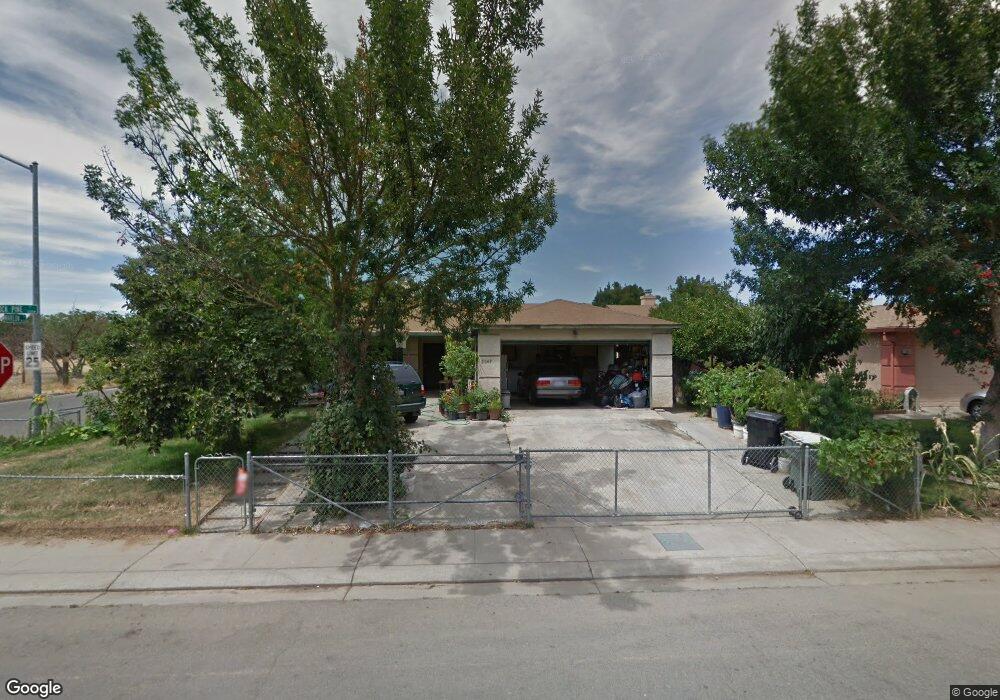
2069 Rock Pine Ct Modesto, CA 95351
West Modesto NeighborhoodEstimated Value: $189,000 - $403,000
3
Beds
2
Baths
1,238
Sq Ft
$260/Sq Ft
Est. Value
About This Home
This home is located at 2069 Rock Pine Ct, Modesto, CA 95351 and is currently estimated at $322,478, approximately $260 per square foot. 2069 Rock Pine Ct is a home located in Stanislaus County with nearby schools including Harriette Kirschen Elementary School, Mark Twain Junior High School, and Modesto High School.
Ownership History
Date
Name
Owned For
Owner Type
Purchase Details
Closed on
Jul 2, 2001
Sold by
Chhim Prim David and Chhim Prim Phaney
Bought by
Chhim Prim David and Chhim Prim Phaney
Current Estimated Value
Purchase Details
Closed on
Dec 22, 1995
Sold by
Corn & Harris Development Llc
Bought by
Chhim Prim David and Chhim Prim Phany
Home Financials for this Owner
Home Financials are based on the most recent Mortgage that was taken out on this home.
Original Mortgage
$85,634
Outstanding Balance
$1,754
Interest Rate
7.38%
Mortgage Type
FHA
Estimated Equity
$320,724
Purchase Details
Closed on
Apr 3, 1995
Sold by
Union Safe Deposit Bank
Bought by
Corn & Harris Development
Home Financials for this Owner
Home Financials are based on the most recent Mortgage that was taken out on this home.
Original Mortgage
$22,050
Interest Rate
8.81%
Create a Home Valuation Report for This Property
The Home Valuation Report is an in-depth analysis detailing your home's value as well as a comparison with similar homes in the area
Home Values in the Area
Average Home Value in this Area
Purchase History
| Date | Buyer | Sale Price | Title Company |
|---|---|---|---|
| Chhim Prim David | -- | First American Title Ins Co | |
| Chhim Prim David | $88,500 | North American Title Co | |
| Corn & Harris Development Llc | -- | North American Title Co | |
| Corn & Harris Development | $152,000 | North American Title Ins Co |
Source: Public Records
Mortgage History
| Date | Status | Borrower | Loan Amount |
|---|---|---|---|
| Open | Chhim Prim David | $85,634 | |
| Previous Owner | Corn & Harris Development | $22,050 | |
| Closed | Chhim Prim David | $2,594 |
Source: Public Records
Tax History Compared to Growth
Tax History
| Year | Tax Paid | Tax Assessment Tax Assessment Total Assessment is a certain percentage of the fair market value that is determined by local assessors to be the total taxable value of land and additions on the property. | Land | Improvement |
|---|---|---|---|---|
| 2025 | $1,637 | $146,997 | $33,212 | $113,785 |
| 2024 | $1,562 | $144,115 | $32,561 | $111,554 |
| 2023 | $1,538 | $141,290 | $31,923 | $109,367 |
| 2022 | $1,499 | $138,521 | $31,298 | $107,223 |
| 2021 | $1,408 | $135,806 | $30,685 | $105,121 |
| 2020 | $1,435 | $134,415 | $30,371 | $104,044 |
| 2019 | $1,400 | $131,780 | $29,776 | $102,004 |
| 2018 | $1,332 | $129,197 | $29,193 | $100,004 |
| 2017 | $1,298 | $126,665 | $28,621 | $98,044 |
| 2016 | $1,348 | $124,182 | $28,060 | $96,122 |
| 2015 | $1,330 | $122,318 | $27,639 | $94,679 |
| 2014 | $1,256 | $115,000 | $20,000 | $95,000 |
Source: Public Records
Map
Nearby Homes
- 1116 Pine Meadow Ct
- 2001 John St
- 1900 Kenneth St
- 1827 John St
- 1805 Kenneth St
- 732 Bristlecone Way
- 2370 Ridge Rd
- 700 White Dove Cir
- 601 Wade Ave
- 1512 Swalls Ln
- 1932 San Ramos Way
- 1801 W Hatch Rd
- 1700 St Charlotte Ln
- 1608 Ohio Ave
- 1625 Bedford Ave
- 1546 Kazmir Ct
- 828 Clementa Way
- 816 Clementa Way
- 622 Josilane
- 812 Clementa Way
- 2065 Rock Pine Ct
- 2072 Ridgecrest Dr
- 2061 Rock Pine Ct
- 2068 Ridgecrest Dr
- 2064 Ridgecrest Dr
- 2068 Rock Pine Ct
- 2057 Rock Pine Ct
- 2064 Rock Pine Ct
- 2060 Rock Pine Ct
- 2060 Ridgecrest Dr
- 2053 Rock Pine Ct
- 2056 Rock Pine Ct
- 2056 Ridgecrest Dr
- 1132 Marlow St
- 1224 Marlow St
- 2049 Rock Pine Ct
- 2052 Rock Pine Ct
- 2049 Robertson Rd
- 1129 Desert Pine Ct
- 2045 Robertson Rd