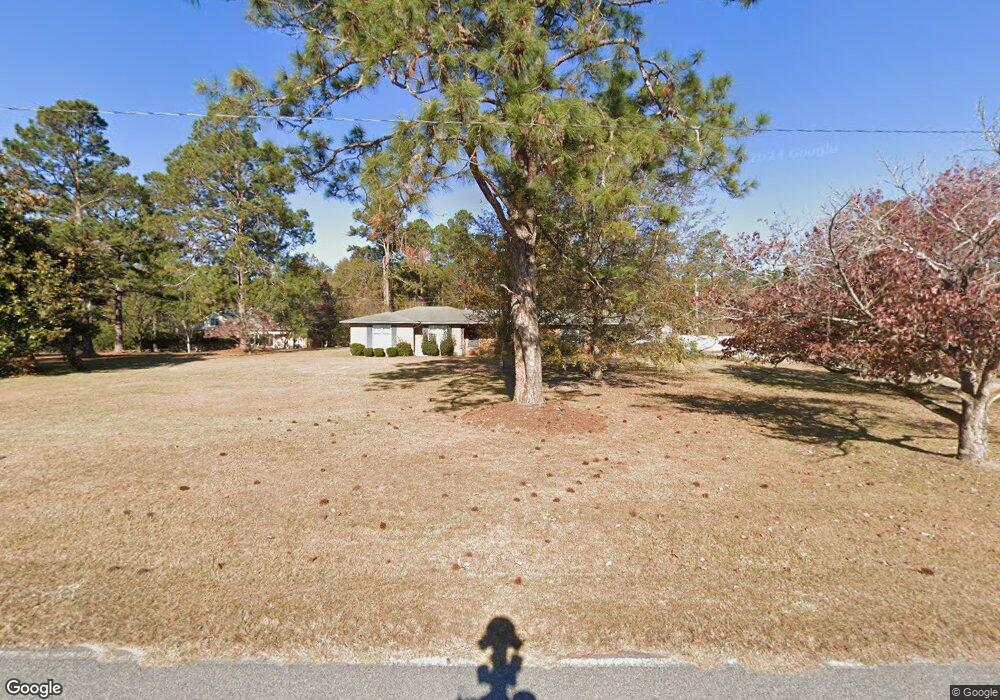
207 Avondale Dr Sylvania, GA 30467
Estimated Value: $236,769 - $293,000
4
Beds
2
Baths
2,742
Sq Ft
$95/Sq Ft
Est. Value
About This Home
This home is located at 207 Avondale Dr, Sylvania, GA 30467 and is currently estimated at $259,442, approximately $94 per square foot. 207 Avondale Dr is a home located in Screven County with nearby schools including Screven County Elementary School, Screven County Middle School, and Screven County High School.
Ownership History
Date
Name
Owned For
Owner Type
Purchase Details
Closed on
Jun 24, 2010
Sold by
Stephens Jeffrey A
Bought by
Hinson Rhonda A
Current Estimated Value
Home Financials for this Owner
Home Financials are based on the most recent Mortgage that was taken out on this home.
Original Mortgage
$181,347
Outstanding Balance
$120,340
Interest Rate
4.77%
Mortgage Type
New Conventional
Estimated Equity
$139,102
Purchase Details
Closed on
Mar 31, 2005
Sold by
Martin James D
Bought by
Stephens Jeffrey A and Stephens Jennifer M
Home Financials for this Owner
Home Financials are based on the most recent Mortgage that was taken out on this home.
Original Mortgage
$117,600
Interest Rate
5.74%
Mortgage Type
New Conventional
Purchase Details
Closed on
Jul 18, 1988
Sold by
Sindersine Mancy
Bought by
Martin James D and Martin Shi
Create a Home Valuation Report for This Property
The Home Valuation Report is an in-depth analysis detailing your home's value as well as a comparison with similar homes in the area
Home Values in the Area
Average Home Value in this Area
Purchase History
| Date | Buyer | Sale Price | Title Company |
|---|---|---|---|
| Hinson Rhonda A | $175,000 | -- | |
| Stephens Jeffrey A | $147,000 | -- | |
| Martin James D | $72,000 | -- |
Source: Public Records
Mortgage History
| Date | Status | Borrower | Loan Amount |
|---|---|---|---|
| Open | Hinson Rhonda A | $181,347 | |
| Previous Owner | Stephens Jeffrey A | $117,600 |
Source: Public Records
Tax History Compared to Growth
Tax History
| Year | Tax Paid | Tax Assessment Tax Assessment Total Assessment is a certain percentage of the fair market value that is determined by local assessors to be the total taxable value of land and additions on the property. | Land | Improvement |
|---|---|---|---|---|
| 2024 | $2,348 | $74,440 | $6,600 | $67,840 |
| 2023 | $2,430 | $74,440 | $6,600 | $67,840 |
| 2022 | $2,284 | $70,200 | $6,600 | $63,600 |
| 2021 | $2,182 | $63,880 | $6,600 | $57,280 |
| 2020 | $2,171 | $61,560 | $6,600 | $54,960 |
| 2019 | $2,167 | $61,560 | $6,600 | $54,960 |
| 2018 | $2,123 | $60,440 | $6,600 | $53,840 |
| 2017 | $2,123 | $60,440 | $6,600 | $53,840 |
| 2016 | $2,130 | $61,280 | $6,600 | $54,680 |
| 2015 | -- | $59,280 | $6,600 | $52,680 |
| 2014 | -- | $58,720 | $6,600 | $52,120 |
| 2013 | -- | $58,720 | $6,600 | $52,120 |
Source: Public Records
Map
Nearby Homes
- 315 Cork Pond Rd
- 0 Burtons Ferry Hwy Unit 10475688
- 0 Burtons Ferry Hwy Unit 10549042
- 0 Dune Ln Unit SA331767
- 501 N Main St
- 222 Bridgeton Dr
- 406 N Main St
- 416 Abram St
- 221 N Main Streets
- 0 Runs Branch Rd Unit 10617232
- 850 Buttermilk Rd
- 207 Georgia Ave
- 104 Wildwood St
- 0 Friendship Rd Unit 10597657
- 0 Friendship Rd Unit SA339071
- 0 Poor Robin Unit 329695
- 208 Wildwood Dr
- 611 W Ogeechee St
- 814 S Main St
- 123 Hiers Ave
- 211 Avondale Dr
- 222 Cork Pond Rd
- 111 Avondale Dr
- 220 Cork Pond Rd
- 226 Cork Pond Rd
- 215 Avondale Dr
- 107 Avondale Dr
- 230 Cork Pond Rd
- 114 Avondale Dr
- 303 Avondale Dr
- 302 Cork Pond Rd
- 110 Avondale Dr
- 307 Cork Pond Rd
- 305 Avondale Dr
- 103 Avondale Dr
- 104 Cork Pond Rd
- 136 Morningside Dr
- 306 Cork Pond Rd
- 106 Avondale Dr