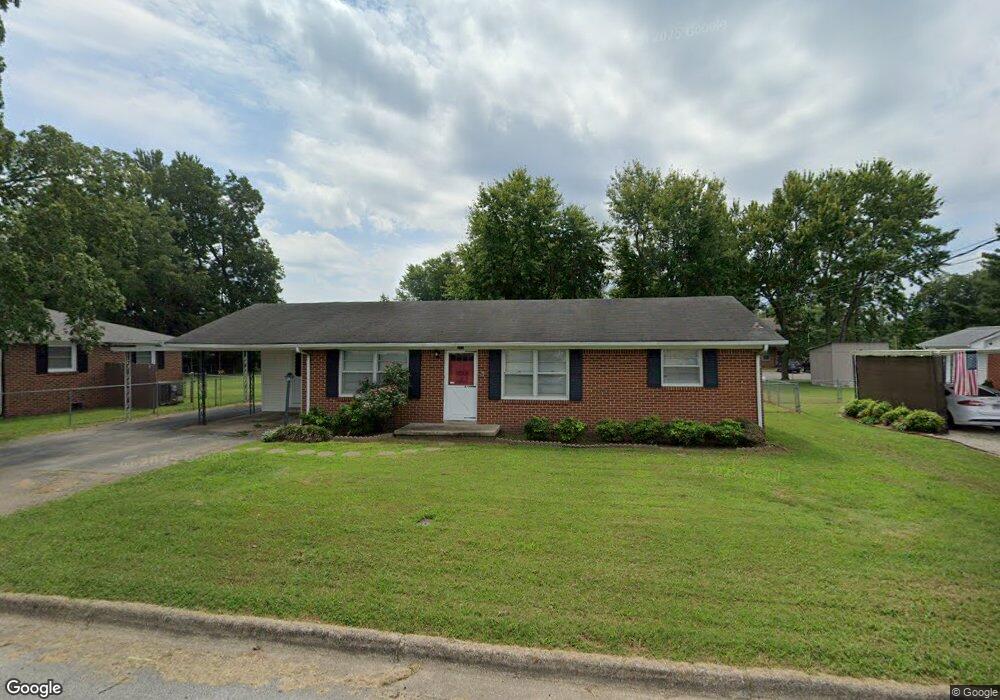
207 Jackson St Lawrenceburg, TN 38464
Estimated Value: $162,448 - $188,000
--
Bed
1
Bath
1,100
Sq Ft
$158/Sq Ft
Est. Value
About This Home
This home is located at 207 Jackson St, Lawrenceburg, TN 38464 and is currently estimated at $173,362, approximately $157 per square foot. 207 Jackson St is a home located in Lawrence County with nearby schools including Ingram Sowell Elementary School, David Crockett Elementary School, and Lawrenceburg Public Elementary School.
Ownership History
Date
Name
Owned For
Owner Type
Purchase Details
Closed on
Apr 4, 2018
Sold by
Mashburn Carolyn A and Mashburn Kenneth R
Bought by
Huskey Michael and Huskey Judy
Current Estimated Value
Purchase Details
Closed on
Jun 16, 2004
Sold by
Joshua Huckaba
Bought by
Mashburn Kenneth R
Home Financials for this Owner
Home Financials are based on the most recent Mortgage that was taken out on this home.
Original Mortgage
$58,900
Interest Rate
6.25%
Purchase Details
Closed on
Apr 19, 2001
Sold by
Marie Buie Edith
Bought by
Joshua Huckaba
Home Financials for this Owner
Home Financials are based on the most recent Mortgage that was taken out on this home.
Original Mortgage
$33,886
Interest Rate
6.9%
Purchase Details
Closed on
Sep 10, 1965
Bought by
Buie Client O
Create a Home Valuation Report for This Property
The Home Valuation Report is an in-depth analysis detailing your home's value as well as a comparison with similar homes in the area
Home Values in the Area
Average Home Value in this Area
Purchase History
| Date | Buyer | Sale Price | Title Company |
|---|---|---|---|
| Huskey Michael | $37,800 | None Available | |
| Mashburn Kenneth R | $59,000 | -- | |
| Joshua Huckaba | $43,500 | -- | |
| Buie Client O | -- | -- |
Source: Public Records
Mortgage History
| Date | Status | Borrower | Loan Amount |
|---|---|---|---|
| Previous Owner | Buie Client O | $58,900 | |
| Previous Owner | Buie Client O | $33,886 |
Source: Public Records
Tax History Compared to Growth
Tax History
| Year | Tax Paid | Tax Assessment Tax Assessment Total Assessment is a certain percentage of the fair market value that is determined by local assessors to be the total taxable value of land and additions on the property. | Land | Improvement |
|---|---|---|---|---|
| 2025 | $829 | $26,675 | $0 | $0 |
| 2024 | $829 | $26,675 | $2,375 | $24,300 |
| 2023 | $829 | $26,675 | $2,375 | $24,300 |
| 2022 | $829 | $26,675 | $2,375 | $24,300 |
| 2021 | $591 | $13,450 | $1,875 | $11,575 |
| 2020 | $591 | $13,450 | $1,875 | $11,575 |
| 2019 | $591 | $13,450 | $1,875 | $11,575 |
| 2018 | $591 | $13,450 | $1,875 | $11,575 |
| 2017 | $591 | $13,450 | $1,875 | $11,575 |
| 2016 | $591 | $13,450 | $1,875 | $11,575 |
| 2015 | $560 | $13,450 | $1,875 | $11,575 |
| 2014 | $539 | $12,950 | $1,875 | $11,075 |
Source: Public Records
Map
Nearby Homes