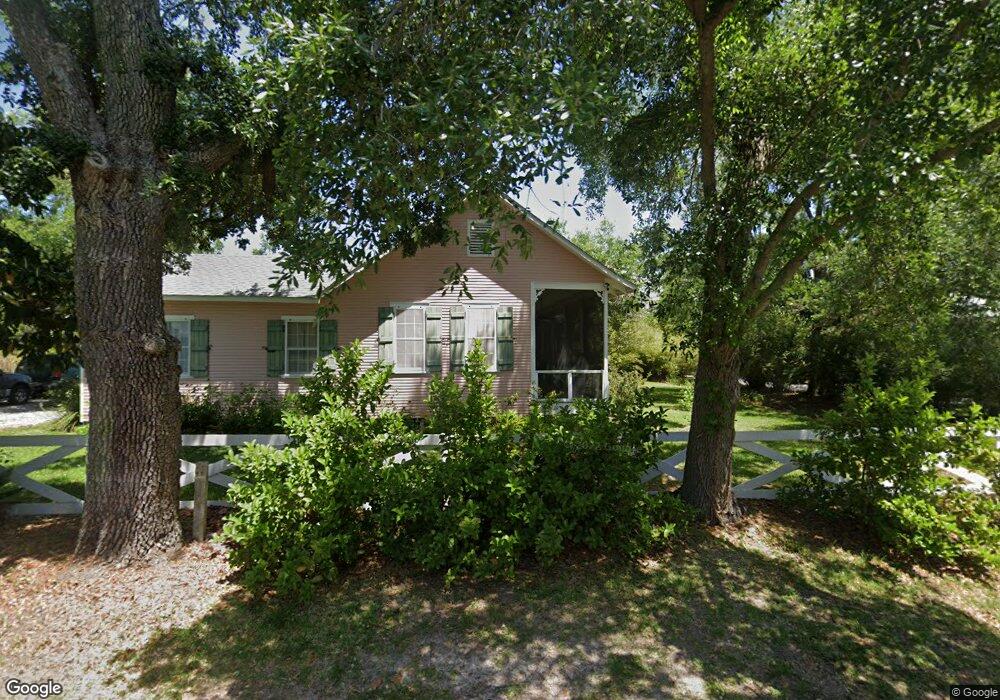
207 Saint Charles St Bay Saint Louis, MS 39520
Estimated Value: $437,000 - $653,000
3
Beds
2
Baths
2,207
Sq Ft
$261/Sq Ft
Est. Value
About This Home
This home is located at 207 Saint Charles St, Bay Saint Louis, MS 39520 and is currently estimated at $576,257, approximately $261 per square foot. 207 Saint Charles St is a home located in Hancock County with nearby schools including Waveland Elementary School, North Bay Elementary School, and Bay Waveland Middle School.
Ownership History
Date
Name
Owned For
Owner Type
Purchase Details
Closed on
Oct 21, 2013
Sold by
Gary Susan S
Bought by
Calonje Sydney and Calonje Paul
Current Estimated Value
Create a Home Valuation Report for This Property
The Home Valuation Report is an in-depth analysis detailing your home's value as well as a comparison with similar homes in the area
Home Values in the Area
Average Home Value in this Area
Purchase History
| Date | Buyer | Sale Price | Title Company |
|---|---|---|---|
| Calonje Sydney | -- | -- |
Source: Public Records
Tax History Compared to Growth
Tax History
| Year | Tax Paid | Tax Assessment Tax Assessment Total Assessment is a certain percentage of the fair market value that is determined by local assessors to be the total taxable value of land and additions on the property. | Land | Improvement |
|---|---|---|---|---|
| 2024 | $4,792 | $41,666 | $17,135 | $24,531 |
| 2023 | $4,633 | $40,280 | $17,135 | $23,145 |
| 2022 | $4,633 | $40,280 | $17,135 | $23,145 |
| 2021 | $4,584 | $40,280 | $17,135 | $23,145 |
| 2020 | $3,217 | $25,502 | $4,284 | $21,218 |
| 2019 | $2,452 | $19,577 | $4,284 | $15,293 |
| 2018 | $2,452 | $19,577 | $4,284 | $15,293 |
| 2017 | $2,414 | $19,582 | $4,284 | $15,298 |
| 2016 | $2,366 | $19,582 | $4,284 | $15,298 |
| 2015 | $1,248 | $10,623 | $4,284 | $6,339 |
| 2014 | $1,243 | $10,623 | $4,284 | $6,339 |
| 2013 | $967 | $8,888 | $4,284 | $4,604 |
Source: Public Records
Map
Nearby Homes
- 515 Third St Unit 5
- 216 Carre Ct Unit 3
- 317 Ballentine St
- 204 Caron Ln
- 0 St Charles Lot St
- 205 Caron Ln
- 233 Ballentine St
- 232 Citizen St
- 7015 Third St
- 240 Sycamore St
- 253 Sycamore St
- 0 Sycamore St
- 0 Central Ave Unit 4122916
- 423 Ballentine St
- 115 Citizen St
- 316 Ramoneda St
- 119 Washington St
- Lots 1&7 Central Ave
- 520 Bookter St
- 446 Ballentine St
- 207 Charles St
- 205 St Charles St
- 205 Saint Charles St
- 209 Saint Charles St
- 414 Third St
- 468 3rd St
- 211 Saint Charles St
- 203 Saint Charles St
- 208 Saint Charles St
- 412 Third St
- 410 Third St
- 212 Saint Charles St
- 202 Saint Charles St
- 215 Saint Charles St
- 308 Ballentine St
- 107 Carre Ct
- 348 Ballentine Parcel A Lot St
- 419 3rd St
- 348 Ballentine Lot Parcel A St
- 419 Third St