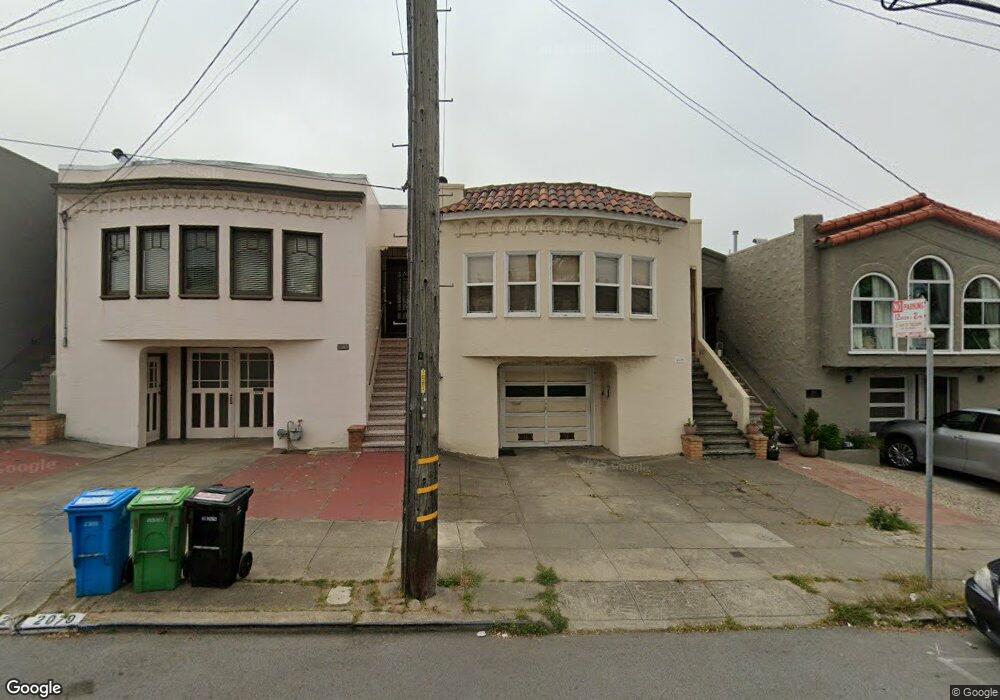
2075 18th Ave San Francisco, CA 94116
Inner Parkside NeighborhoodEstimated Value: $1,440,000 - $1,545,060
2
Beds
1
Bath
1,370
Sq Ft
$1,095/Sq Ft
Est. Value
About This Home
This home is located at 2075 18th Ave, San Francisco, CA 94116 and is currently estimated at $1,499,765, approximately $1,094 per square foot. 2075 18th Ave is a home located in San Francisco County with nearby schools including Clarendon Alternative Elementary School, Presidio Middle School, and Cornerstone Academy-Lawton Campus.
Ownership History
Date
Name
Owned For
Owner Type
Purchase Details
Closed on
Feb 5, 2021
Sold by
Liao Jack Chia Fun and Chang Young
Bought by
Liao Jack Chia Fun and Chang Yongen
Current Estimated Value
Purchase Details
Closed on
Mar 29, 2012
Sold by
Cheng Tsz Mei
Bought by
Liao Jack and Chang Yongen
Home Financials for this Owner
Home Financials are based on the most recent Mortgage that was taken out on this home.
Original Mortgage
$599,200
Outstanding Balance
$412,308
Interest Rate
3.83%
Mortgage Type
New Conventional
Estimated Equity
$1,087,457
Purchase Details
Closed on
Jun 24, 1999
Sold by
Fok Sui Wah
Bought by
Wu James Ip Lui
Home Financials for this Owner
Home Financials are based on the most recent Mortgage that was taken out on this home.
Original Mortgage
$200,000
Interest Rate
5.75%
Create a Home Valuation Report for This Property
The Home Valuation Report is an in-depth analysis detailing your home's value as well as a comparison with similar homes in the area
Home Values in the Area
Average Home Value in this Area
Purchase History
| Date | Buyer | Sale Price | Title Company |
|---|---|---|---|
| Liao Jack Chia Fun | -- | None Available | |
| Liao Jack | $749,000 | Fidelity National Title Co | |
| Wu James Ip Lui | -- | First American Title Co | |
| Cheng Tsz Mei | -- | First American Title Co |
Source: Public Records
Mortgage History
| Date | Status | Borrower | Loan Amount |
|---|---|---|---|
| Open | Liao Jack | $599,200 | |
| Previous Owner | Cheng Tsz Mei | $200,000 | |
| Closed | Cheng Tsz Mei | $60,000 |
Source: Public Records
Tax History Compared to Growth
Tax History
| Year | Tax Paid | Tax Assessment Tax Assessment Total Assessment is a certain percentage of the fair market value that is determined by local assessors to be the total taxable value of land and additions on the property. | Land | Improvement |
|---|---|---|---|---|
| 2025 | $11,594 | $940,773 | $659,422 | $281,351 |
| 2024 | $11,594 | $922,328 | $646,493 | $275,835 |
| 2023 | $11,415 | $904,244 | $633,817 | $270,427 |
| 2022 | $11,191 | $886,515 | $621,390 | $265,125 |
| 2021 | $10,991 | $869,133 | $609,206 | $259,927 |
| 2020 | $11,050 | $860,222 | $602,960 | $257,262 |
| 2019 | $10,673 | $843,356 | $591,138 | $252,218 |
| 2018 | $10,233 | $826,821 | $579,548 | $247,273 |
| 2017 | $9,813 | $810,610 | $568,185 | $242,425 |
| 2016 | $9,641 | $794,717 | $557,045 | $237,672 |
| 2015 | $9,520 | $782,780 | $548,678 | $234,102 |
| 2014 | $9,268 | $767,448 | $537,931 | $229,517 |
Source: Public Records
Map
Nearby Homes
- 2116 18th Ave
- 2114 20th Ave
- 701 Quintara St
- 2211 19th Ave
- 2050 22nd Ave
- 1983 15th Ave
- 1200 Ortega St Unit 1202
- 2042 23rd Ave
- 1883-1885 16th Ave
- 1845 Pacheco St
- 730 Santiago St
- 2123 Funston Ave
- 2292 16th Ave
- 353 Rivera St
- 2319-2321 21st Ave
- 1831 14th Ave
- 1850 23rd Ave
- 634-636 Taraval St
- 50 Cascade Walk
- 2418 20th Ave Unit 101
- 2071 18th Ave
- 2079 18th Ave
- 2067 18th Ave
- 2083 18th Ave
- 2063 18th Ave
- 2087 18th Ave
- 2051 18th Ave
- 2059 18th Ave
- 2091 18th Ave
- 922 Quintara St
- 2074 19th Ave
- 2078 19th Ave Unit 2080
- 2070 19th Ave
- 2055 18th Ave
- 930 Quintara St
- 2066 19th Ave Unit 2068
- 900 Quintara St
- 934 Quintara St
- 2062 19th Ave
- 2058 19th Ave Unit 1