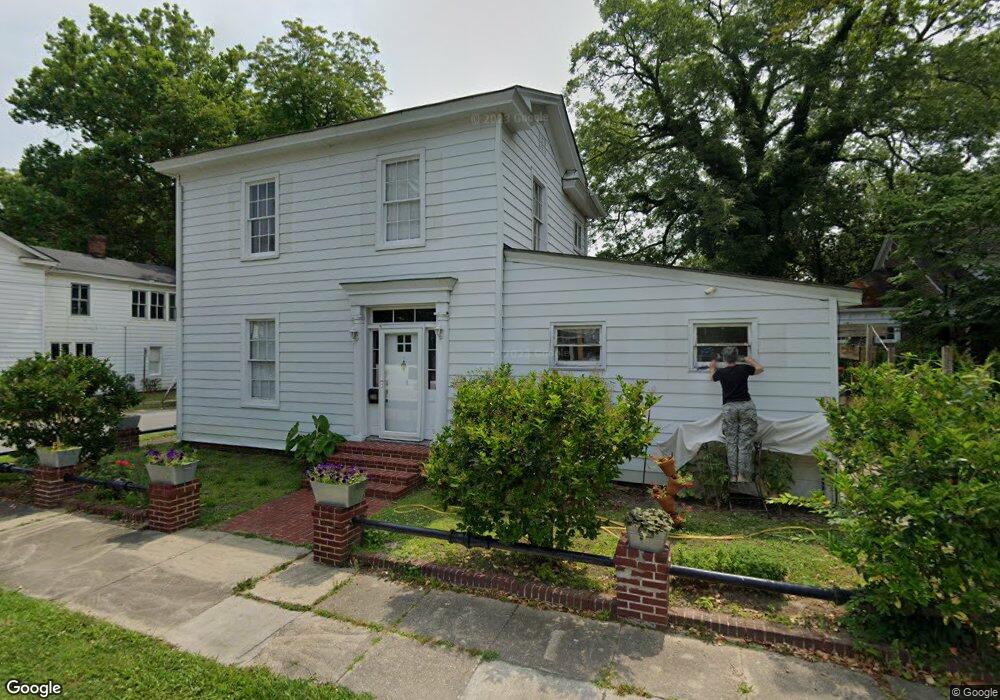
208 Grace St Suffolk, VA 23434
Downtown Suffolk NeighborhoodEstimated Value: $230,000 - $408,000
3
Beds
3
Baths
2,300
Sq Ft
$131/Sq Ft
Est. Value
About This Home
This home is located at 208 Grace St, Suffolk, VA 23434 and is currently estimated at $301,985, approximately $131 per square foot. 208 Grace St is a home located in Suffolk City with nearby schools including Hillpoint Elementary School, King's Fork Middle School, and King's Fork High School.
Ownership History
Date
Name
Owned For
Owner Type
Purchase Details
Closed on
Feb 23, 2024
Sold by
Baderspach Odile
Bought by
Oniell Col
Current Estimated Value
Home Financials for this Owner
Home Financials are based on the most recent Mortgage that was taken out on this home.
Original Mortgage
$12,375
Outstanding Balance
$12,171
Interest Rate
6.69%
Mortgage Type
New Conventional
Estimated Equity
$289,814
Purchase Details
Closed on
Jan 12, 2016
Sold by
Baker Ruth S
Bought by
Baderspach Odile
Purchase Details
Closed on
Sep 19, 2012
Sold by
Annas Tr Jack E
Bought by
Baker Ruth S
Create a Home Valuation Report for This Property
The Home Valuation Report is an in-depth analysis detailing your home's value as well as a comparison with similar homes in the area
Home Values in the Area
Average Home Value in this Area
Purchase History
| Date | Buyer | Sale Price | Title Company |
|---|---|---|---|
| Oniell Col | $275,000 | Fidelity National Title | |
| Baderspach Odile | $42,000 | Attorney | |
| Baker Ruth S | $17,050 | -- |
Source: Public Records
Mortgage History
| Date | Status | Borrower | Loan Amount |
|---|---|---|---|
| Open | Oniell Col | $12,375 | |
| Open | Oniell Col | $270,019 |
Source: Public Records
Tax History Compared to Growth
Tax History
| Year | Tax Paid | Tax Assessment Tax Assessment Total Assessment is a certain percentage of the fair market value that is determined by local assessors to be the total taxable value of land and additions on the property. | Land | Improvement |
|---|---|---|---|---|
| 2024 | $4,057 | $102,100 | $46,900 | $55,200 |
| 2023 | $1,485 | $98,300 | $44,700 | $53,600 |
| 2022 | $845 | $77,500 | $31,900 | $45,600 |
| 2021 | $789 | $71,100 | $25,500 | $45,600 |
| 2020 | $764 | $68,800 | $23,200 | $45,600 |
| 2019 | $764 | $68,800 | $23,200 | $45,600 |
| 2018 | $888 | $69,100 | $23,200 | $45,900 |
| 2017 | $739 | $69,100 | $23,200 | $45,900 |
| 2016 | $739 | $69,100 | $23,200 | $45,900 |
| 2015 | $614 | $69,100 | $23,200 | $45,900 |
| 2014 | $614 | $69,100 | $23,200 | $45,900 |
Source: Public Records
Map
Nearby Homes