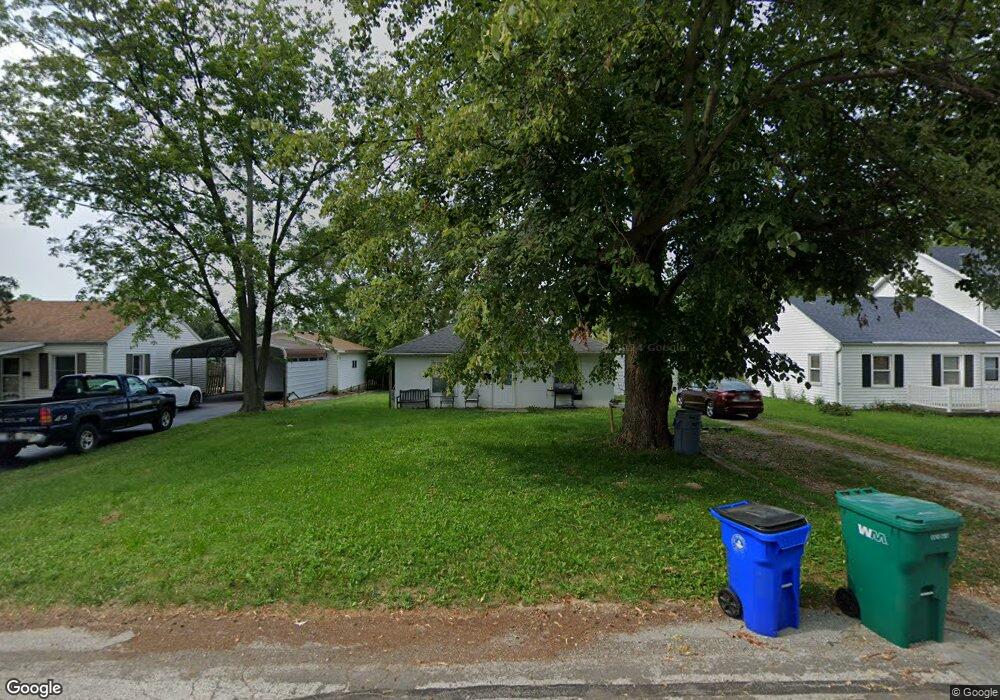
2088 W Leafland Ave Decatur, IL 62522
Fairlawn NeighborhoodEstimated Value: $41,000 - $59,810
2
Beds
1
Bath
850
Sq Ft
$61/Sq Ft
Est. Value
About This Home
This home is located at 2088 W Leafland Ave, Decatur, IL 62522 and is currently estimated at $51,703, approximately $60 per square foot. 2088 W Leafland Ave is a home located in Macon County with nearby schools including Stephen Decatur Middle School and Northwest Christian Campus.
Ownership History
Date
Name
Owned For
Owner Type
Purchase Details
Closed on
Mar 9, 2022
Sold by
Badman Ellis
Bought by
Family Lease Llc
Current Estimated Value
Purchase Details
Closed on
Sep 16, 2021
Sold by
Law Nancy L
Bought by
Peterson Taylor and Wallace Vallerie
Purchase Details
Closed on
Nov 18, 2008
Sold by
Born Gerald and Born Dorothy
Bought by
Badman Ellis
Home Financials for this Owner
Home Financials are based on the most recent Mortgage that was taken out on this home.
Original Mortgage
$35,036
Interest Rate
5.95%
Mortgage Type
New Conventional
Purchase Details
Closed on
Aug 30, 2007
Sold by
Peters Cheryl
Bought by
Born Gerald and Born Dorothy
Home Financials for this Owner
Home Financials are based on the most recent Mortgage that was taken out on this home.
Original Mortgage
$24,000
Interest Rate
6.79%
Mortgage Type
New Conventional
Purchase Details
Closed on
May 12, 2006
Sold by
Reish Angela M
Bought by
Peters Cheryl
Purchase Details
Closed on
Apr 1, 2002
Create a Home Valuation Report for This Property
The Home Valuation Report is an in-depth analysis detailing your home's value as well as a comparison with similar homes in the area
Home Values in the Area
Average Home Value in this Area
Purchase History
| Date | Buyer | Sale Price | Title Company |
|---|---|---|---|
| Family Lease Llc | $37,500 | None Listed On Document | |
| Family Lease Llc | $37,500 | None Listed On Document | |
| Peterson Taylor | -- | None Listed On Document | |
| Badman Ellis | $44,000 | None Available | |
| Born Gerald | $33,000 | Decatur Title Co Llc | |
| Peters Cheryl | -- | None Available | |
| -- | $79,000 | -- |
Source: Public Records
Mortgage History
| Date | Status | Borrower | Loan Amount |
|---|---|---|---|
| Previous Owner | Badman Ellis | $35,036 | |
| Previous Owner | Born Gerald | $24,000 |
Source: Public Records
Tax History Compared to Growth
Tax History
| Year | Tax Paid | Tax Assessment Tax Assessment Total Assessment is a certain percentage of the fair market value that is determined by local assessors to be the total taxable value of land and additions on the property. | Land | Improvement |
|---|---|---|---|---|
| 2024 | $1,585 | $16,369 | $3,218 | $13,151 |
| 2023 | $1,571 | $15,789 | $3,104 | $12,685 |
| 2022 | $1,494 | $14,612 | $2,873 | $11,739 |
| 2021 | $1,404 | $13,646 | $2,683 | $10,963 |
| 2020 | $1,384 | $13,012 | $2,558 | $10,454 |
| 2019 | $1,384 | $13,012 | $2,558 | $10,454 |
| 2018 | $1,286 | $12,243 | $1,754 | $10,489 |
| 2017 | $688 | $12,570 | $1,801 | $10,769 |
| 2016 | $708 | $12,698 | $1,819 | $10,879 |
| 2015 | $510 | $9,943 | $1,787 | $8,156 |
| 2014 | $478 | $9,844 | $1,769 | $8,075 |
| 2013 | $476 | $10,213 | $1,835 | $8,378 |
Source: Public Records
Map
Nearby Homes
- 2201 W Packard St
- 2195 W Center St
- 1524 N Summit Ave
- 0 Valley View Place
- 1415 N Dennis Ave
- 1675 W Center St
- 1645 W Center St
- 1706 W Division St
- 1451 W Marietta St
- 2125 Clearmont Ave
- 1530 W Cushing St
- 1535 N Mcclellan Ave
- 1319 W Waggoner St
- 2121 Barding Ave
- 2262 Yorkshire Dr
- 1625 W Garfield Ave
- 435 N Summit Ave
- 415 N Summit Ave
- 2406 W Olive St
- 917 N Wilder Ave
- 2092 W Leafland Ave
- 2058 W Leafland Ave
- 2095 W Leafland Ave
- 2050 W Leafland Ave
- 2075 W Leafland Ave
- 2045 W Leafland Ave
- 1195 N Westlawn Ave
- 1199 N Westlawn Ave
- 2035 W Leafland Ave
- 1132 N Westlawn Ave
- 2025 W Leafland Ave
- 1191 N Westlawn Ave
- 1126 N Westlawn Ave
- 1133 N Oakcrest Ave
- 2015 W Leafland Ave
- 2057 W Waggoner St
- 1135 N Westlawn Ave
- 2047 W Waggoner St
- 2073 W Waggoner St
- 1351 N Home Park Ave