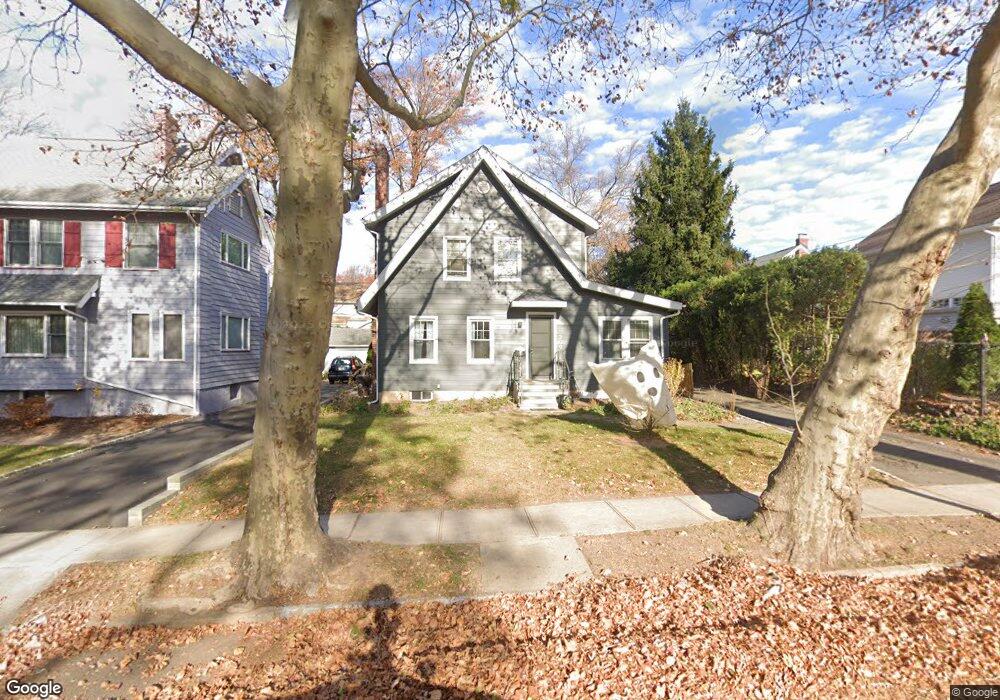
209 Audley St South Orange, NJ 07079
Estimated Value: $898,545 - $1,063,000
--
Bed
--
Bath
1,376
Sq Ft
$710/Sq Ft
Est. Value
About This Home
This home is located at 209 Audley St, South Orange, NJ 07079 and is currently estimated at $977,386, approximately $710 per square foot. 209 Audley St is a home located in Essex County with nearby schools including South Mountain Elementary School, South Orange Middle School, and Columbia Senior High School.
Ownership History
Date
Name
Owned For
Owner Type
Purchase Details
Closed on
Oct 23, 2020
Sold by
Fransson Heidi
Bought by
Fransson Heidi
Current Estimated Value
Home Financials for this Owner
Home Financials are based on the most recent Mortgage that was taken out on this home.
Original Mortgage
$385,000
Outstanding Balance
$341,813
Interest Rate
2.8%
Mortgage Type
New Conventional
Estimated Equity
$635,573
Purchase Details
Closed on
Sep 17, 2015
Sold by
Fransson Sven Anders
Bought by
Fransson Heidi
Purchase Details
Closed on
Nov 4, 2009
Sold by
Langella Charles N and Langella Amy
Bought by
Fransson Sven Anders and Fransson Heidi
Home Financials for this Owner
Home Financials are based on the most recent Mortgage that was taken out on this home.
Original Mortgage
$391,200
Interest Rate
5.01%
Mortgage Type
New Conventional
Purchase Details
Closed on
Sep 30, 2005
Sold by
Tyms Michael
Bought by
Langella Charles and Langella Amy
Home Financials for this Owner
Home Financials are based on the most recent Mortgage that was taken out on this home.
Original Mortgage
$359,650
Interest Rate
5.81%
Mortgage Type
New Conventional
Create a Home Valuation Report for This Property
The Home Valuation Report is an in-depth analysis detailing your home's value as well as a comparison with similar homes in the area
Home Values in the Area
Average Home Value in this Area
Purchase History
| Date | Buyer | Sale Price | Title Company |
|---|---|---|---|
| Fransson Heidi | -- | None Listed On Document | |
| Fransson Heidi | -- | None Available | |
| Fransson Sven Anders | $489,000 | Chicago Title Insurance Co | |
| Langella Charles | $485,000 | -- |
Source: Public Records
Mortgage History
| Date | Status | Borrower | Loan Amount |
|---|---|---|---|
| Open | Fransson Heidi | $385,000 | |
| Previous Owner | Fransson Sven Anders | $391,200 | |
| Previous Owner | Langella Charles | $359,650 |
Source: Public Records
Tax History Compared to Growth
Tax History
| Year | Tax Paid | Tax Assessment Tax Assessment Total Assessment is a certain percentage of the fair market value that is determined by local assessors to be the total taxable value of land and additions on the property. | Land | Improvement |
|---|---|---|---|---|
| 2025 | $17,658 | $809,600 | $397,500 | $412,100 |
| 2024 | $17,658 | $809,600 | $397,500 | $412,100 |
| 2022 | $17,026 | $485,500 | $333,000 | $152,500 |
| 2021 | $16,434 | $485,500 | $333,000 | $152,500 |
| 2020 | $15,924 | $485,500 | $333,000 | $152,500 |
| 2019 | $15,526 | $485,500 | $333,000 | $152,500 |
| 2018 | $15,293 | $485,500 | $333,000 | $152,500 |
| 2017 | $14,915 | $485,500 | $333,000 | $152,500 |
| 2016 | $13,980 | $365,200 | $225,000 | $140,200 |
| 2015 | $13,655 | $365,200 | $225,000 | $140,200 |
| 2014 | $13,370 | $365,200 | $225,000 | $140,200 |
Source: Public Records
Map
Nearby Homes
- 8 Kendal Ave
- 311 Lenox Ave
- 24 Saint Lawrence Ave
- 24 St Lawrence Ave
- 432 Walton Rd
- 118 Rynda Rd
- 372 Valley St Unit G2
- 161 Church St
- 83 Hixon Place
- 73 Jefferson Ave
- 13 Collinwood Rd Unit 15
- 15 4th St
- 78 Massel Terrace
- 168 Wyoming Ave
- 31-41 Church St Unit 306
- 22 S Ridgewood Rd
- 60 Mews Ln
- 16 Mews Ln Unit 16
- 40 Mews Ln
- 64-66 3rd St