209 Audrey Ln Austin, IN 47102
Estimated Value: $165,000 - $201,000
4
Beds
2
Baths
1,464
Sq Ft
$128/Sq Ft
Est. Value
About This Home
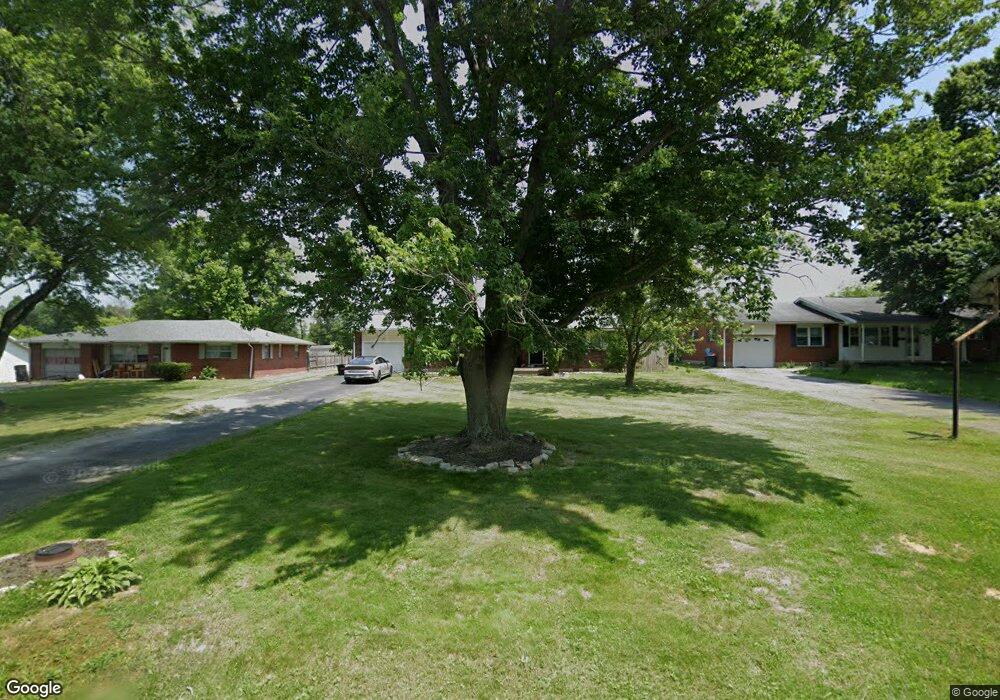
This home is located at 209 Audrey Ln, Austin, IN 47102 and is currently estimated at $187,764, approximately $128 per square foot. 209 Audrey Ln is a home located in Scott County with nearby schools including Austin Elementary School, Austin Middle School, and Austin High School.
Ownership History
Date
Name
Owned For
Owner Type
Purchase Details
Closed on
Aug 20, 2020
Sold by
Bessenger Family Limited Partnership
Bought by
Stagnolia Michael R and Stagnolia Elisa M
Current Estimated Value
Purchase Details
Closed on
Jul 15, 2008
Sold by
Bessenger Fam Limited Partners
Bought by
Clark James P and Clark Melissa
Home Financials for this Owner
Home Financials are based on the most recent Mortgage that was taken out on this home.
Original Mortgage
$138,900
Interest Rate
6%
Mortgage Type
Seller Take Back
Purchase Details
Closed on
Aug 5, 2005
Sold by
Estep Felix and Rice Faye
Bought by
Bessenger Family Lp
Create a Home Valuation Report for This Property
The Home Valuation Report is an in-depth analysis detailing your home's value as well as a comparison with similar homes in the area
Home Values in the Area
Average Home Value in this Area
Purchase History
| Date | Buyer | Sale Price | Title Company |
|---|---|---|---|
| Stagnolia Michael R | $144,900 | None Available | |
| Clark James P | $139,900 | -- | |
| Clark James P | $139,900 | None Available | |
| Bessenger Family Lp | -- | None Available |
Source: Public Records
Mortgage History
| Date | Status | Borrower | Loan Amount |
|---|---|---|---|
| Previous Owner | Clark James P | $138,900 |
Source: Public Records
Tax History Compared to Growth
Tax History
| Year | Tax Paid | Tax Assessment Tax Assessment Total Assessment is a certain percentage of the fair market value that is determined by local assessors to be the total taxable value of land and additions on the property. | Land | Improvement |
|---|---|---|---|---|
| 2024 | $1,178 | $103,200 | $16,000 | $87,200 |
| 2023 | $1,289 | $111,100 | $16,000 | $95,100 |
| 2022 | $1,173 | $109,300 | $16,000 | $93,300 |
| 2021 | $1,001 | $97,700 | $16,000 | $81,700 |
| 2020 | $839 | $89,900 | $16,000 | $73,900 |
| 2019 | $768 | $87,800 | $16,000 | $71,800 |
| 2018 | $529 | $76,600 | $16,000 | $60,600 |
| 2017 | $491 | $75,900 | $16,000 | $59,900 |
| 2016 | $484 | $75,300 | $16,000 | $59,300 |
| 2014 | $612 | $80,800 | $17,000 | $63,800 |
| 2013 | $612 | $81,800 | $17,000 | $64,800 |
Source: Public Records
Map
Nearby Homes