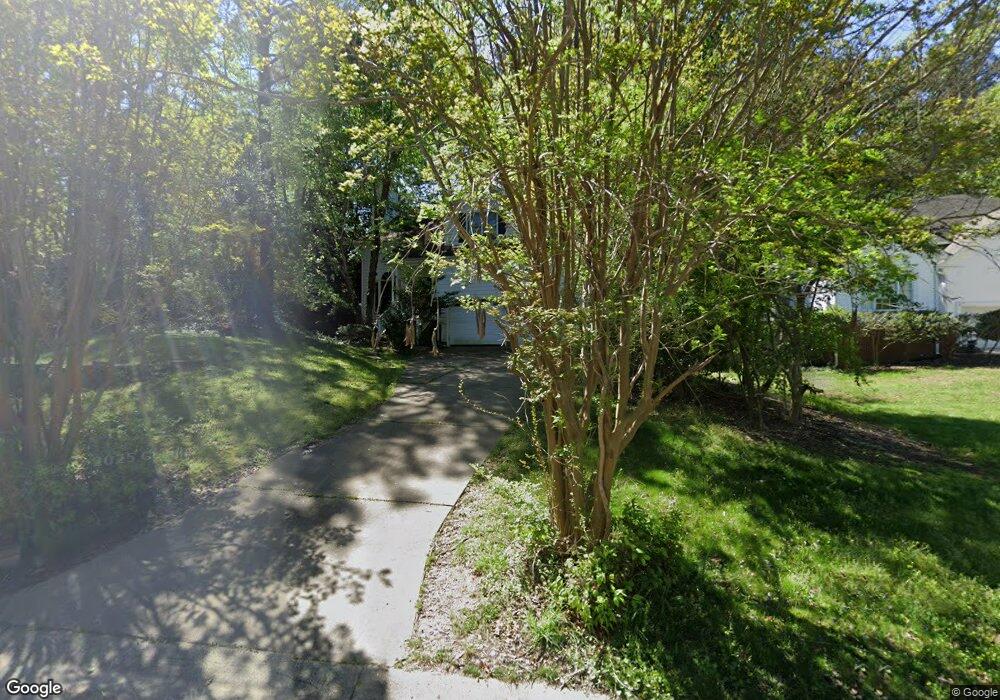
209 Avent Pines Ln Holly Springs, NC 27540
Estimated Value: $392,000 - $440,000
3
Beds
3
Baths
1,701
Sq Ft
$243/Sq Ft
Est. Value
About This Home
This home is located at 209 Avent Pines Ln, Holly Springs, NC 27540 and is currently estimated at $412,698, approximately $242 per square foot. 209 Avent Pines Ln is a home located in Wake County with nearby schools including Holly Grove Elementary School, Holly Grove Middle School, and Holly Springs High School.
Ownership History
Date
Name
Owned For
Owner Type
Purchase Details
Closed on
Feb 5, 2008
Sold by
Hignite Franklin Grant and Hignite Lindsey
Bought by
Adams Tara Kai
Current Estimated Value
Home Financials for this Owner
Home Financials are based on the most recent Mortgage that was taken out on this home.
Original Mortgage
$157,200
Outstanding Balance
$99,157
Interest Rate
6.06%
Mortgage Type
Purchase Money Mortgage
Estimated Equity
$313,541
Purchase Details
Closed on
May 23, 2003
Sold by
Kist Michael G and Kist Mary Ellen
Bought by
Hignite Franklin Grant and Hignite Lindsey
Home Financials for this Owner
Home Financials are based on the most recent Mortgage that was taken out on this home.
Original Mortgage
$155,500
Interest Rate
6.5%
Mortgage Type
Purchase Money Mortgage
Create a Home Valuation Report for This Property
The Home Valuation Report is an in-depth analysis detailing your home's value as well as a comparison with similar homes in the area
Home Values in the Area
Average Home Value in this Area
Purchase History
| Date | Buyer | Sale Price | Title Company |
|---|---|---|---|
| Adams Tara Kai | $196,500 | None Available | |
| Hignite Franklin Grant | $155,500 | -- |
Source: Public Records
Mortgage History
| Date | Status | Borrower | Loan Amount |
|---|---|---|---|
| Open | Adams Tara Kai | $157,200 | |
| Previous Owner | Hignite Franklin Grant | $155,500 |
Source: Public Records
Tax History Compared to Growth
Tax History
| Year | Tax Paid | Tax Assessment Tax Assessment Total Assessment is a certain percentage of the fair market value that is determined by local assessors to be the total taxable value of land and additions on the property. | Land | Improvement |
|---|---|---|---|---|
| 2025 | $3,089 | $356,572 | $115,000 | $241,572 |
| 2024 | $3,076 | $356,572 | $115,000 | $241,572 |
| 2023 | $2,674 | $246,038 | $52,000 | $194,038 |
| 2022 | $2,582 | $246,038 | $52,000 | $194,038 |
| 2021 | $2,534 | $246,038 | $52,000 | $194,038 |
| 2020 | $2,534 | $246,038 | $52,000 | $194,038 |
| 2019 | $2,522 | $207,974 | $52,000 | $155,974 |
| 2018 | $2,280 | $207,974 | $52,000 | $155,974 |
| 2017 | $2,199 | $207,974 | $52,000 | $155,974 |
| 2016 | $2,168 | $207,974 | $52,000 | $155,974 |
| 2015 | $2,202 | $207,930 | $52,000 | $155,930 |
| 2014 | $2,126 | $207,930 | $52,000 | $155,930 |
Source: Public Records
Map
Nearby Homes
- 161 Summit Oaks Ln
- 100 Avent Pines Ln
- 1712 Avent Ferry Rd
- 233 Hickory Glen Ln
- 101 Covenant Rock Ln
- 208 Autumn Glen Ln
- 933 Hollymont Dr
- 300 Shorehouse Way
- 417 Shorehouse Way
- 0 Old Airport Rd
- 100 Oakmoss Trail
- 505 Pyracantha Dr
- 213 Holly Moor Ln
- 341 Covenant Rock Ln
- 304 Magnolia Meadow Way
- 425 Cahors Trail
- 104 Pointe Park Cir
- 113 Braxman Ln
- 108 Pointe Park Cir
- 305 Tonks Trail
- 205 Avent Pines Ln
- 604 Holly Branch Dr
- 608 Holly Branch Dr
- 217 Avent Pines Ln
- 600 Holly Branch Dr
- 201 Avent Pines Ln
- 216 Avent Pines Ln
- 612 Holly Branch Dr
- 212 Avent Pines Ln
- 220 Avent Pines Ln
- 208 Avent Pines Ln
- 221 Avent Pines Ln
- 204 Avent Pines Ln
- 224 Avent Pines Ln
- 200 Avent Pines Ln
- 232 Avent Pines Ln
- 228 Avent Pines Ln
- 117 Avent Pines Ln
- 609 Holly Branch Dr
- 613 Holly Branch Dr