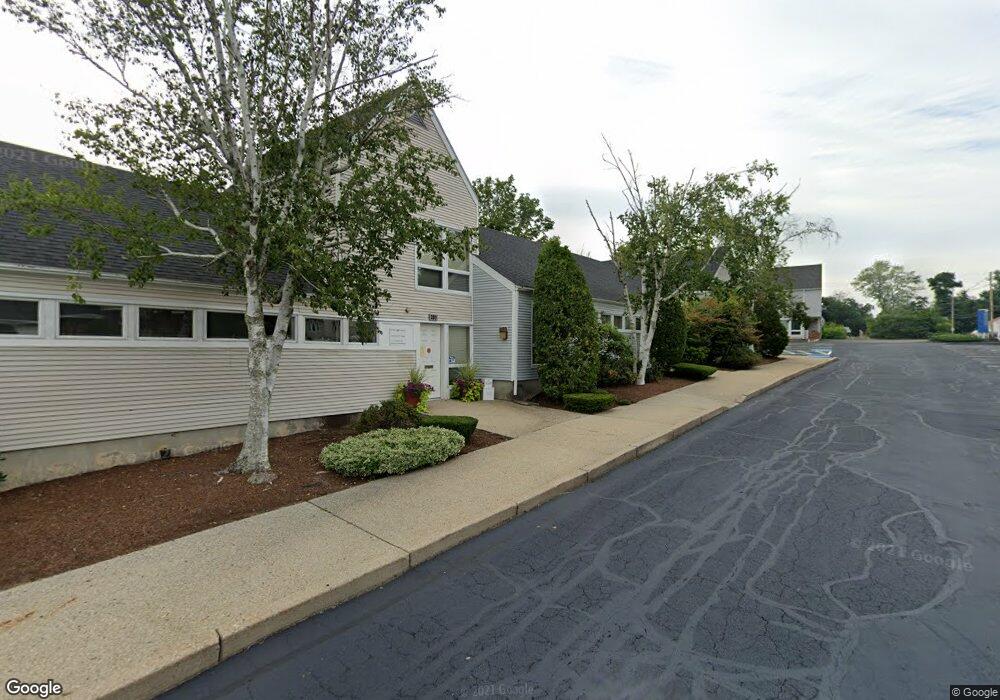
209 Quincy St Unit 209 Brockton, MA 02302
Estimated Value: $198,905
3
Beds
2
Baths
888
Sq Ft
$224/Sq Ft
Est. Value
About This Home
This home is located at 209 Quincy St Unit 209, Brockton, MA 02302 and is currently estimated at $198,905, approximately $223 per square foot. 209 Quincy St Unit 209 is a home located in Plymouth County with nearby schools including Brookfield Elementary School, Mary E. Baker Elementary School, and Downey Elementary School.
Ownership History
Date
Name
Owned For
Owner Type
Purchase Details
Closed on
May 30, 2023
Sold by
Quincy St 209 Unit 2 Llc
Bought by
Monterio Kenny
Current Estimated Value
Purchase Details
Closed on
Jul 28, 2021
Sold by
Flynn Eugene L
Bought by
Quincy St 209 2 Llc
Purchase Details
Closed on
Oct 2, 2019
Sold by
Lynn Charles Realty Llc
Bought by
Flynn Eugene L
Home Financials for this Owner
Home Financials are based on the most recent Mortgage that was taken out on this home.
Original Mortgage
$95,625
Interest Rate
3.5%
Mortgage Type
New Conventional
Purchase Details
Closed on
Feb 7, 2002
Sold by
Knab Richard E
Bought by
Quincy St Rt
Create a Home Valuation Report for This Property
The Home Valuation Report is an in-depth analysis detailing your home's value as well as a comparison with similar homes in the area
Home Values in the Area
Average Home Value in this Area
Purchase History
| Date | Buyer | Sale Price | Title Company |
|---|---|---|---|
| Monterio Kenny | $170,000 | None Available | |
| Quincy St 209 2 Llc | $127,500 | None Available | |
| Flynn Eugene L | $127,500 | -- | |
| Quincy St Rt | $120,000 | -- |
Source: Public Records
Mortgage History
| Date | Status | Borrower | Loan Amount |
|---|---|---|---|
| Previous Owner | Flynn Eugene L | $95,625 | |
| Previous Owner | Quincy St Rt | $120,000 | |
| Previous Owner | Quincy St Rt | $100,000 |
Source: Public Records
Tax History Compared to Growth
Tax History
| Year | Tax Paid | Tax Assessment Tax Assessment Total Assessment is a certain percentage of the fair market value that is determined by local assessors to be the total taxable value of land and additions on the property. | Land | Improvement |
|---|---|---|---|---|
| 2025 | $3,349 | $138,400 | $0 | $138,400 |
| 2024 | $2,835 | $117,900 | $0 | $117,900 |
| 2023 | $1,803 | $69,300 | $0 | $69,300 |
| 2022 | $1,916 | $68,000 | $0 | $68,000 |
| 2021 | $4,179 | $141,000 | $0 | $141,000 |
| 2020 | $4,288 | $141,000 | $0 | $141,000 |
| 2019 | $4,250 | $134,200 | $0 | $134,200 |
| 2018 | $3,930 | $131,000 | $0 | $131,000 |
| 2017 | $3,930 | $119,300 | $0 | $119,300 |
| 2016 | $3,625 | $113,200 | $0 | $113,200 |
| 2015 | $3,835 | $113,200 | $0 | $113,200 |
| 2014 | $3,844 | $113,200 | $0 | $113,200 |
Source: Public Records
Map
Nearby Homes