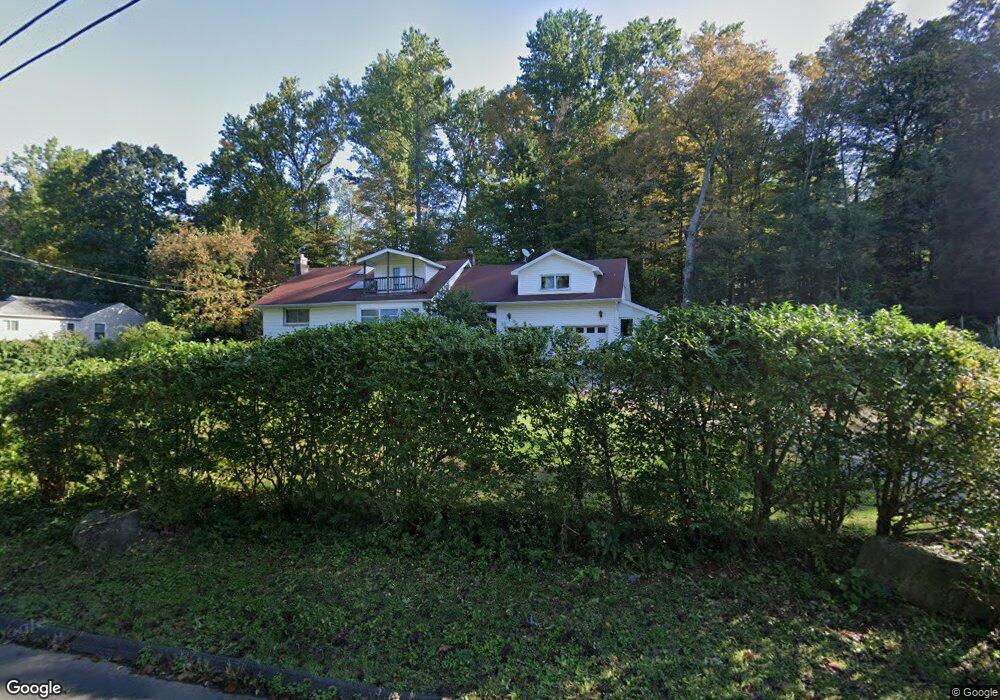
21 Albion Rd New Fairfield, CT 06812
Estimated Value: $460,000 - $480,807
5
Beds
3
Baths
1,542
Sq Ft
$305/Sq Ft
Est. Value
About This Home
This home is located at 21 Albion Rd, New Fairfield, CT 06812 and is currently estimated at $469,952, approximately $304 per square foot. 21 Albion Rd is a home located in Fairfield County with nearby schools including Meeting House Hill School, New Fairfield Middle School, and New Fairfield High School.
Ownership History
Date
Name
Owned For
Owner Type
Purchase Details
Closed on
Oct 28, 2014
Sold by
Fnma
Bought by
Nm Properties 8715 Llc
Current Estimated Value
Purchase Details
Closed on
Oct 17, 2012
Sold by
Citi Mortgage Inc
Bought by
Federal National Mortgage Association
Purchase Details
Closed on
Oct 15, 2012
Sold by
Tastan Mevlut
Bought by
Citimortgage Inc
Purchase Details
Closed on
Apr 11, 2003
Sold by
Muller Roy A
Bought by
Tastan Mevlut and Tastan Nuran
Create a Home Valuation Report for This Property
The Home Valuation Report is an in-depth analysis detailing your home's value as well as a comparison with similar homes in the area
Home Values in the Area
Average Home Value in this Area
Purchase History
| Date | Buyer | Sale Price | Title Company |
|---|---|---|---|
| Nm Properties 8715 Llc | $106,050 | -- | |
| Federal National Mortgage Association | -- | -- | |
| Citimortgage Inc | -- | -- | |
| Tastan Mevlut | $215,000 | -- |
Source: Public Records
Mortgage History
| Date | Status | Borrower | Loan Amount |
|---|---|---|---|
| Previous Owner | Tastan Mevlut | $150,000 | |
| Previous Owner | Tastan Mevlut | $200,000 | |
| Previous Owner | Tastan Mevlut | $100,000 |
Source: Public Records
Tax History Compared to Growth
Tax History
| Year | Tax Paid | Tax Assessment Tax Assessment Total Assessment is a certain percentage of the fair market value that is determined by local assessors to be the total taxable value of land and additions on the property. | Land | Improvement |
|---|---|---|---|---|
| 2025 | $8,107 | $307,900 | $99,800 | $208,100 |
| 2024 | $7,275 | $199,200 | $93,000 | $106,200 |
| 2023 | $6,952 | $199,200 | $93,000 | $106,200 |
| 2022 | $6,468 | $199,200 | $93,000 | $106,200 |
| 2021 | $6,273 | $199,200 | $93,000 | $106,200 |
| 2020 | $6,092 | $199,200 | $93,000 | $106,200 |
| 2019 | $5,426 | $175,600 | $76,000 | $99,600 |
| 2018 | $5,370 | $175,600 | $76,000 | $99,600 |
| 2017 | $5,236 | $175,600 | $76,000 | $99,600 |
| 2016 | $5,036 | $175,600 | $76,000 | $99,600 |
| 2015 | $5,036 | $175,600 | $76,000 | $99,600 |
| 2014 | $4,692 | $179,900 | $83,000 | $96,900 |
Source: Public Records
Map
Nearby Homes