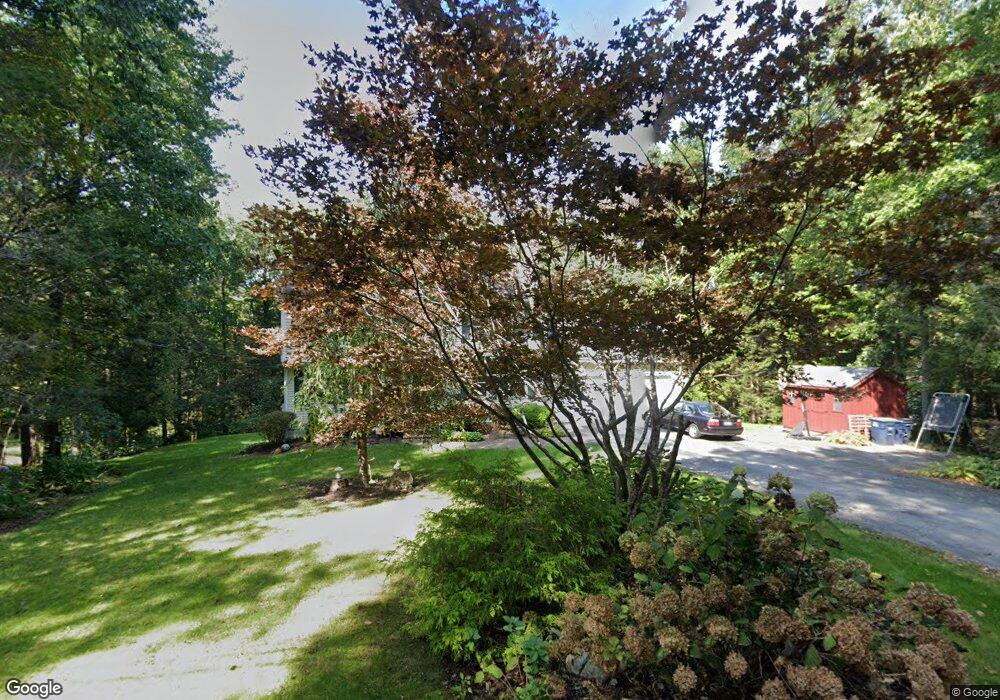
21 Glendale Rd Fiskdale, MA 01518
Estimated Value: $518,000 - $608,000
4
Beds
3
Baths
1,944
Sq Ft
$291/Sq Ft
Est. Value
About This Home
This home is located at 21 Glendale Rd, Fiskdale, MA 01518 and is currently estimated at $565,926, approximately $291 per square foot. 21 Glendale Rd is a home located in Worcester County with nearby schools including Burgess Elementary School, Tantasqua Regional Junior High School, and Tantasqua Regional High School.
Ownership History
Date
Name
Owned For
Owner Type
Purchase Details
Closed on
May 3, 2024
Sold by
Jarzabski Peter J and Pelleti Janet I
Bought by
Pelletti Janet
Current Estimated Value
Home Financials for this Owner
Home Financials are based on the most recent Mortgage that was taken out on this home.
Original Mortgage
$100,000
Outstanding Balance
$96,293
Interest Rate
6.82%
Mortgage Type
Unknown
Estimated Equity
$469,633
Purchase Details
Closed on
Mar 31, 2000
Sold by
Conly Peter L and Conly Linda M
Bought by
Pelleti Janet I and Jarzabski Peter J
Purchase Details
Closed on
Nov 26, 1991
Sold by
Wentworth Phil O
Bought by
Connly Peter L and Linda Connly
Purchase Details
Closed on
May 29, 1987
Sold by
Provencher Richard
Bought by
Rogers R J
Create a Home Valuation Report for This Property
The Home Valuation Report is an in-depth analysis detailing your home's value as well as a comparison with similar homes in the area
Home Values in the Area
Average Home Value in this Area
Purchase History
| Date | Buyer | Sale Price | Title Company |
|---|---|---|---|
| Pelletti Janet | -- | None Available | |
| Pelletti Janet | -- | None Available | |
| Pelleti Janet I | $215,000 | -- | |
| Connly Peter L | $162,500 | -- | |
| Pelleti Janet I | $215,000 | -- | |
| Connly Peter L | $162,500 | -- | |
| Rogers R J | $225,000 | -- |
Source: Public Records
Mortgage History
| Date | Status | Borrower | Loan Amount |
|---|---|---|---|
| Open | Pelletti Janet | $100,000 | |
| Closed | Pelletti Janet | $100,000 | |
| Open | Pelletti Janet | $210,000 | |
| Closed | Pelletti Janet | $210,000 | |
| Previous Owner | Rogers R J | $175,000 | |
| Previous Owner | Rogers R J | $172,000 |
Source: Public Records
Tax History Compared to Growth
Tax History
| Year | Tax Paid | Tax Assessment Tax Assessment Total Assessment is a certain percentage of the fair market value that is determined by local assessors to be the total taxable value of land and additions on the property. | Land | Improvement |
|---|---|---|---|---|
| 2025 | $6,914 | $434,000 | $109,100 | $324,900 |
| 2024 | $6,792 | $411,900 | $106,900 | $305,000 |
| 2023 | $6,406 | $354,500 | $93,200 | $261,300 |
| 2022 | $6,166 | $322,000 | $84,500 | $237,500 |
| 2021 | $5,797 | $304,800 | $80,700 | $224,100 |
| 2020 | $5,797 | $304,800 | $80,700 | $224,100 |
| 2019 | $5,563 | $290,500 | $82,900 | $207,600 |
| 2018 | $5,332 | $274,300 | $79,100 | $195,200 |
| 2017 | $5,108 | $263,300 | $76,400 | $186,900 |
| 2016 | $5,029 | $261,800 | $74,200 | $187,600 |
| 2015 | $4,997 | $259,700 | $74,200 | $185,500 |
Source: Public Records
Map
Nearby Homes
- 285 Brookfield Rd
- 97 Apple Rd
- 16 Schoolhouse Cross Rd
- 314 The Trail
- 2 Tupelo Dr
- 0 Brookfield Rd
- 16 Rice Corner Rd
- 146-A Cedar St
- 28 Allen Rd
- 224 E Hill Rd
- 18 Fox Run
- 293 Brookfield Rd
- 323 New Boston Rd
- 54 Little Alum Rd
- 5 Hinman St Unit 4
- 243 Brookfield Rd
- 537 Main St
- 132 Lane 9
- 1 Lane 22
- 504 Main St
- 17 Glendale Rd
- 23 Glendale Rd
- 13 Glendale Rd
- 25 Glendale Rd
- 27 Glendale Rd
- 9 Glendale Rd
- 12 Glendale Rd
- 29 Glendale Rd
- 5 Glendale Rd
- 3 Glendale Rd
- 31 Glendale Rd
- 28 Glendale Rd
- 33 Glendale Rd
- 294 Brookfield Rd
- 294 Brookfield Rd
- 296 Brookfield Rd
- 292 Brookfield Rd
- 1 Glendale Rd
- 298 Brookfield Rd
- 290 Brookfield Rd