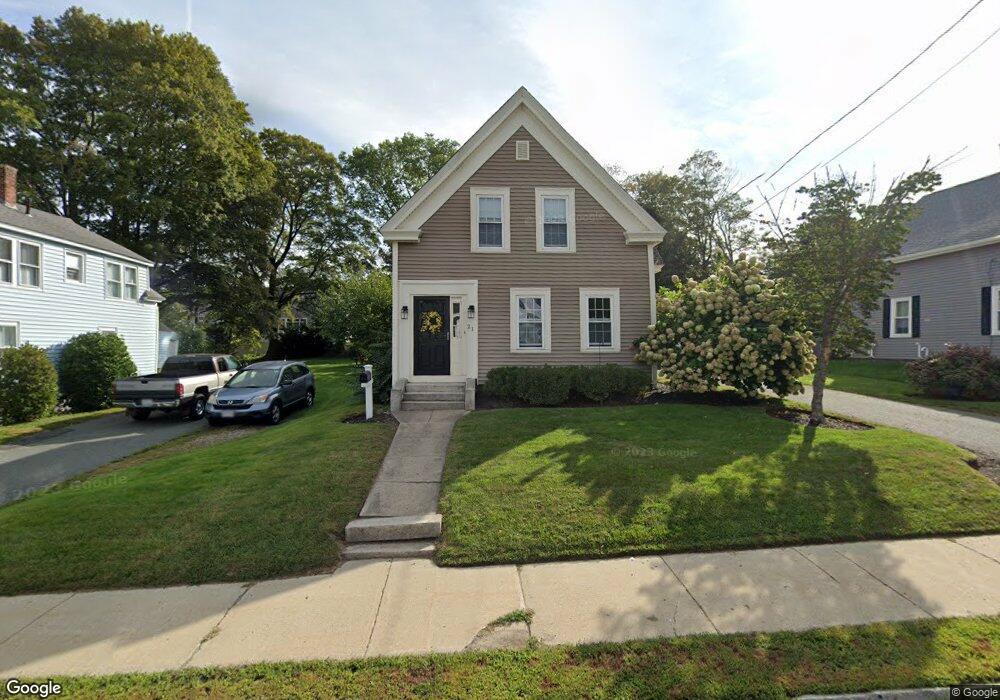
21 Grove St Hopkinton, MA 01748
Estimated Value: $641,468 - $805,000
4
Beds
1
Bath
2,656
Sq Ft
$272/Sq Ft
Est. Value
About This Home
This home is located at 21 Grove St, Hopkinton, MA 01748 and is currently estimated at $721,367, approximately $271 per square foot. 21 Grove St is a home located in Middlesex County with nearby schools including Hopkins Elementary School, Elmwood Elementary School, and Hopkinton Middle School.
Ownership History
Date
Name
Owned For
Owner Type
Purchase Details
Closed on
Sep 11, 2003
Sold by
Deiana Helen F and Kenney John F
Bought by
Kenney John F and Kenney Terri E
Current Estimated Value
Home Financials for this Owner
Home Financials are based on the most recent Mortgage that was taken out on this home.
Original Mortgage
$117,000
Outstanding Balance
$53,765
Interest Rate
6.22%
Mortgage Type
Purchase Money Mortgage
Estimated Equity
$667,602
Purchase Details
Closed on
Jan 28, 1988
Sold by
Bernard Extr Leon J
Bought by
Kenney John F
Home Financials for this Owner
Home Financials are based on the most recent Mortgage that was taken out on this home.
Original Mortgage
$100,800
Interest Rate
10.65%
Mortgage Type
Purchase Money Mortgage
Create a Home Valuation Report for This Property
The Home Valuation Report is an in-depth analysis detailing your home's value as well as a comparison with similar homes in the area
Home Values in the Area
Average Home Value in this Area
Purchase History
| Date | Buyer | Sale Price | Title Company |
|---|---|---|---|
| Kenney John F | -- | -- | |
| Kenney John F | $126,000 | -- |
Source: Public Records
Mortgage History
| Date | Status | Borrower | Loan Amount |
|---|---|---|---|
| Open | Kenney John F | $117,000 | |
| Previous Owner | Kenney John F | $17,699 | |
| Previous Owner | Kenney John F | $8,281 | |
| Previous Owner | Kenney John F | $100,800 |
Source: Public Records
Tax History Compared to Growth
Tax History
| Year | Tax Paid | Tax Assessment Tax Assessment Total Assessment is a certain percentage of the fair market value that is determined by local assessors to be the total taxable value of land and additions on the property. | Land | Improvement |
|---|---|---|---|---|
| 2025 | $7,192 | $507,200 | $198,200 | $309,000 |
| 2024 | $7,043 | $482,100 | $188,700 | $293,400 |
| 2023 | $7,084 | $448,100 | $165,600 | $282,500 |
| 2022 | $6,248 | $366,900 | $150,600 | $216,300 |
| 2021 | $6,043 | $353,800 | $146,000 | $207,800 |
| 2020 | $5,736 | $341,000 | $142,500 | $198,500 |
| 2019 | $5,455 | $317,700 | $137,300 | $180,400 |
| 2018 | $5,024 | $297,300 | $130,600 | $166,700 |
| 2017 | $4,837 | $287,900 | $126,800 | $161,100 |
| 2016 | $4,782 | $280,800 | $124,300 | $156,500 |
| 2015 | $4,725 | $263,100 | $120,800 | $142,300 |
Source: Public Records
Map
Nearby Homes
- 11 Walcott Valley Dr Unit 11
- 8 Whalen Rd
- 3 Fitch Ave Unit 14
- 68 E Main St
- 22 Sanctuary Ln
- 10 Fitch Ave Unit 9
- 12 Fitch Ave Unit 8
- 14 Fitch Ave Unit 7
- 11 Fitch Ave Unit 18
- 5 Weybridge Ln Unit 5
- 16 Fitch Ave Unit 6
- 13 Fitch Ave
- 13 Fitch Ave Unit 19
- 6 Lilac Ct
- 11 Myrtle Ave Unit 5
- 4 Myrtle Ave Unit 20
- 7 Myrtle Ave Unit 3
- 31 Cherry Ln Unit 31
- 2 Curtis Rd
- 5 Myrtle Ave Unit 2