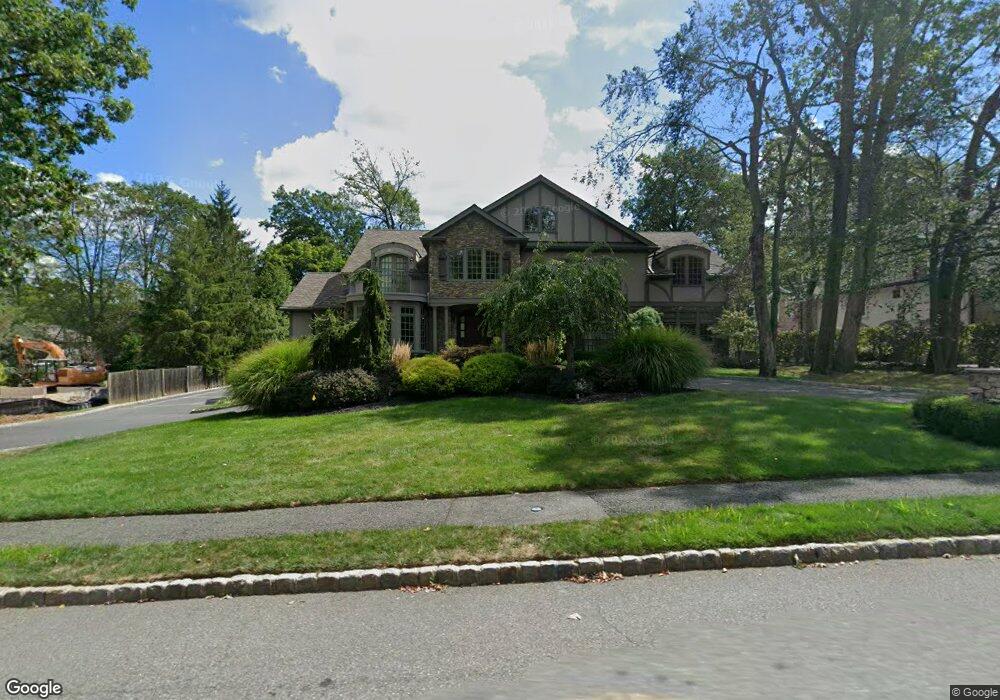
21 Mayhew Dr Livingston, NJ 07039
Estimated Value: $2,552,000 - $2,821,000
--
Bed
--
Bath
5,922
Sq Ft
$447/Sq Ft
Est. Value
About This Home
This home is located at 21 Mayhew Dr, Livingston, NJ 07039 and is currently estimated at $2,649,739, approximately $447 per square foot. 21 Mayhew Dr is a home located in Essex County with nearby schools including Livingston Sr High School and Aquinas Academy.
Ownership History
Date
Name
Owned For
Owner Type
Purchase Details
Closed on
Apr 5, 2009
Sold by
Rabinowitz Darbie and Rabinowitz Robert
Bought by
Rabinowitz Darbie
Current Estimated Value
Purchase Details
Closed on
Dec 1, 2008
Sold by
Rabinowitz Darbie
Bought by
Rabinowitz Darbie and Rabinowitz Robert
Home Financials for this Owner
Home Financials are based on the most recent Mortgage that was taken out on this home.
Original Mortgage
$405,000
Outstanding Balance
$251,299
Interest Rate
4.92%
Mortgage Type
Purchase Money Mortgage
Estimated Equity
$2,398,440
Purchase Details
Closed on
Jul 31, 2008
Sold by
Gertz Alan S and Gertz Andrea Grayson
Bought by
Rabinowitz Darbie
Home Financials for this Owner
Home Financials are based on the most recent Mortgage that was taken out on this home.
Original Mortgage
$400,000
Interest Rate
6.4%
Mortgage Type
Purchase Money Mortgage
Create a Home Valuation Report for This Property
The Home Valuation Report is an in-depth analysis detailing your home's value as well as a comparison with similar homes in the area
Home Values in the Area
Average Home Value in this Area
Purchase History
| Date | Buyer | Sale Price | Title Company |
|---|---|---|---|
| Rabinowitz Darbie | -- | Title Search Agency | |
| Rabinowitz Darbie | -- | Title Search Agency | |
| Rabinowitz Darbie | $1,100,000 | Commonwealth | |
| Gertz Alan S | -- | Commonwealth |
Source: Public Records
Mortgage History
| Date | Status | Borrower | Loan Amount |
|---|---|---|---|
| Open | Rabinowitz Darbie | $405,000 | |
| Closed | Rabinowitz Darbie | $400,000 |
Source: Public Records
Tax History Compared to Growth
Tax History
| Year | Tax Paid | Tax Assessment Tax Assessment Total Assessment is a certain percentage of the fair market value that is determined by local assessors to be the total taxable value of land and additions on the property. | Land | Improvement |
|---|---|---|---|---|
| 2025 | $42,103 | $1,775,000 | $455,000 | $1,320,000 |
| 2024 | $42,103 | $1,775,000 | $455,000 | $1,320,000 |
| 2022 | $41,411 | $1,775,000 | $455,000 | $1,320,000 |
| 2021 | $44,311 | $1,914,900 | $455,000 | $1,459,900 |
| 2020 | $43,487 | $1,914,900 | $455,000 | $1,459,900 |
| 2019 | $28,593 | $1,093,000 | $475,000 | $618,000 |
| 2018 | $28,210 | $1,093,000 | $475,000 | $618,000 |
| 2017 | $27,839 | $1,093,000 | $475,000 | $618,000 |
| 2016 | $27,325 | $1,093,000 | $475,000 | $618,000 |
| 2015 | $26,921 | $1,093,000 | $475,000 | $618,000 |
| 2014 | $26,046 | $1,093,000 | $475,000 | $618,000 |
Source: Public Records
Map
Nearby Homes
- 6 Mayhew Dr
- 44 Lincoln Ave
- 52 Congressional Pkwy
- 27 Filmore Ave
- 61 Hazel Ave
- 53 Rockledge Dr
- 16 Cliffside Dr
- 13 Beverly Rd
- 63 N Livingston Ave
- 11 Beresford Ln
- 30 Grand Terrace
- 24 Garnet Terrace
- 35 Grand Terrace
- 6 Gable Walk
- 41 W Mcclellan Ave
- 224 W Mount Pleasant Ave
- 74 Hillside Terrace
- 15 Highland Dr
- 94 W Cedar St
- 16 Fernwood Rd
- 19 Mayhew Dr
- 23 Mayhew Dr
- 43 Cobblewood Rd
- 41 Cobblewood Rd
- 45 Cobblewood Rd
- 39 Cobblewood Rd
- 47 Cobblewood Rd
- 24 Mayhew Dr
- 25 Mayhew Dr
- 17 Mayhew Dr
- 37 Cobblewood Rd
- 26 Mayhew Dr
- 22 Mayhew Dr
- 49 Cobblewood Rd
- 35 Cobblewood Rd
- 44 Cobblewood Rd
- 46 Cobblewood Rd
- 28 Mayhew Dr
- 42 Cobblewood Rd
- 51 Cobblewood Rd