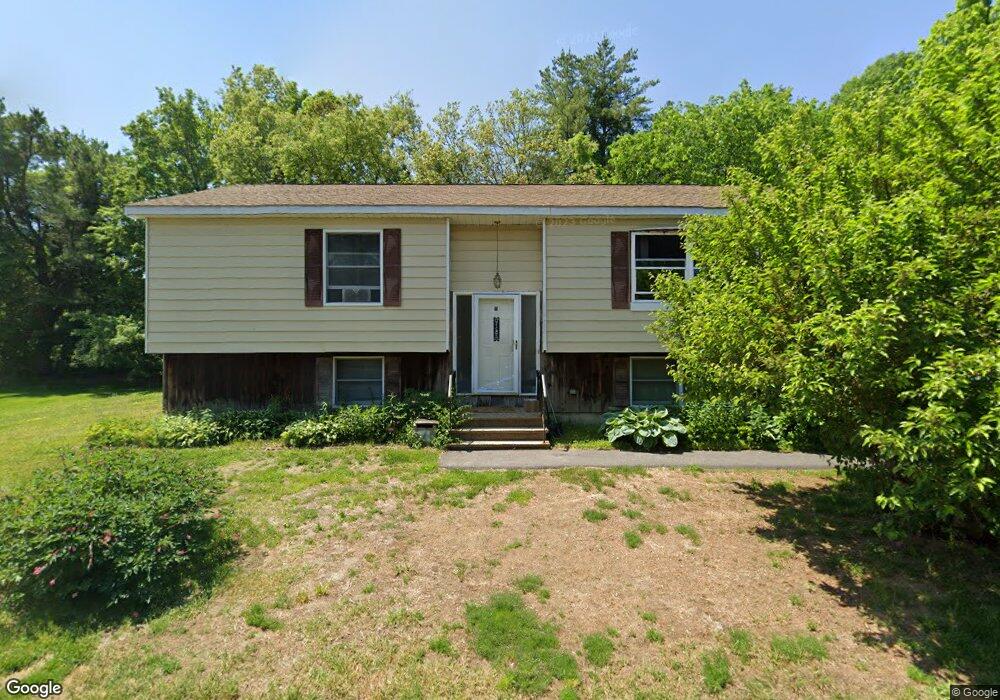
21 State St Rochester, NH 03867
Estimated Value: $367,000 - $429,000
3
Beds
2
Baths
1,117
Sq Ft
$343/Sq Ft
Est. Value
About This Home
This home is located at 21 State St, Rochester, NH 03867 and is currently estimated at $383,356, approximately $343 per square foot. 21 State St is a home located in Strafford County with nearby schools including Mcclelland School, Rochester Middle School, and Spaulding High School.
Ownership History
Date
Name
Owned For
Owner Type
Purchase Details
Closed on
Jan 20, 2023
Sold by
Codling Corey J
Bought by
Codling Corey J and Codling Bonnie
Current Estimated Value
Purchase Details
Closed on
Jun 30, 2021
Sold by
Codling Corey J and Codling Christel J
Bought by
Codling Corey J
Purchase Details
Closed on
May 24, 2000
Sold by
Spector Daniel L and Spector Sharyn A
Bought by
Codling Corey J and Codling Christel J
Home Financials for this Owner
Home Financials are based on the most recent Mortgage that was taken out on this home.
Original Mortgage
$115,500
Interest Rate
8.1%
Create a Home Valuation Report for This Property
The Home Valuation Report is an in-depth analysis detailing your home's value as well as a comparison with similar homes in the area
Home Values in the Area
Average Home Value in this Area
Purchase History
| Date | Buyer | Sale Price | Title Company |
|---|---|---|---|
| Codling Corey J | -- | None Available | |
| Codling Corey J | -- | None Available | |
| Codling Corey J | $116,500 | -- |
Source: Public Records
Mortgage History
| Date | Status | Borrower | Loan Amount |
|---|---|---|---|
| Previous Owner | Codling Corey J | $162,999 | |
| Previous Owner | Codling Corey J | $115,500 |
Source: Public Records
Tax History Compared to Growth
Tax History
| Year | Tax Paid | Tax Assessment Tax Assessment Total Assessment is a certain percentage of the fair market value that is determined by local assessors to be the total taxable value of land and additions on the property. | Land | Improvement |
|---|---|---|---|---|
| 2024 | $4,428 | $298,200 | $101,900 | $196,300 |
| 2023 | $4,288 | $166,600 | $54,100 | $112,500 |
| 2022 | $4,212 | $166,600 | $54,100 | $112,500 |
| 2021 | $4,107 | $166,600 | $54,100 | $112,500 |
| 2020 | $4,100 | $166,600 | $54,100 | $112,500 |
| 2019 | $4,148 | $166,600 | $54,100 | $112,500 |
| 2018 | $4,623 | $168,000 | $37,600 | $130,400 |
| 2017 | $4,423 | $168,000 | $37,600 | $130,400 |
| 2016 | $4,177 | $147,800 | $37,600 | $110,200 |
| 2015 | $4,161 | $147,800 | $37,600 | $110,200 |
| 2014 | $4,060 | $147,800 | $37,600 | $110,200 |
| 2013 | $3,506 | $133,000 | $45,900 | $87,100 |
| 2012 | $3,415 | $133,000 | $45,900 | $87,100 |
Source: Public Records
Map
Nearby Homes