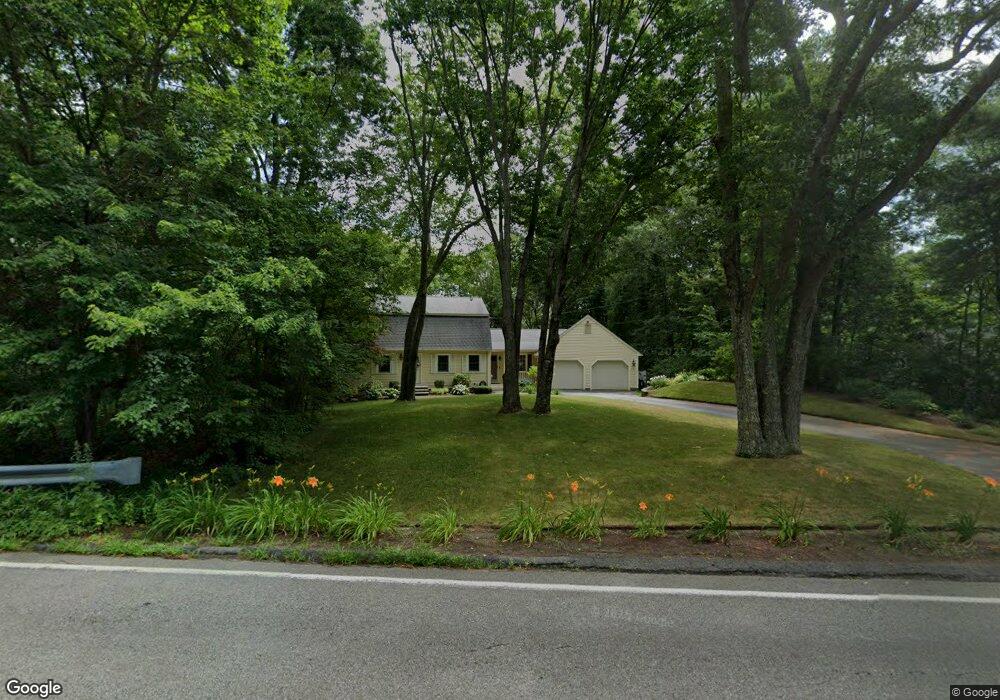
21 Summer St Foxboro, MA 02035
Estimated Value: $734,015 - $892,000
3
Beds
3
Baths
1,946
Sq Ft
$410/Sq Ft
Est. Value
About This Home
This home is located at 21 Summer St, Foxboro, MA 02035 and is currently estimated at $797,504, approximately $409 per square foot. 21 Summer St is a home located in Norfolk County with nearby schools including Foxborough High School, St Mary's Catholic School, and Hands-On-Montessori School.
Ownership History
Date
Name
Owned For
Owner Type
Purchase Details
Closed on
Oct 29, 2020
Sold by
Sullivan Michael and Sullivan Karen
Bought by
Sullivan Ft
Current Estimated Value
Purchase Details
Closed on
Apr 26, 1984
Bought by
Sullivan Michael and Sullivan Karen
Create a Home Valuation Report for This Property
The Home Valuation Report is an in-depth analysis detailing your home's value as well as a comparison with similar homes in the area
Home Values in the Area
Average Home Value in this Area
Purchase History
| Date | Buyer | Sale Price | Title Company |
|---|---|---|---|
| Sullivan Ft | -- | None Available | |
| Sullivan Michael | $83,900 | -- |
Source: Public Records
Mortgage History
| Date | Status | Borrower | Loan Amount |
|---|---|---|---|
| Previous Owner | Sullivan Michael | $1,200,000 | |
| Previous Owner | Sullivan Michael | $150,000 | |
| Previous Owner | Sullivan Michael | $12,000 | |
| Previous Owner | Sullivan Michael | $104,000 |
Source: Public Records
Tax History Compared to Growth
Tax History
| Year | Tax Paid | Tax Assessment Tax Assessment Total Assessment is a certain percentage of the fair market value that is determined by local assessors to be the total taxable value of land and additions on the property. | Land | Improvement |
|---|---|---|---|---|
| 2025 | $8,444 | $638,700 | $262,000 | $376,700 |
| 2024 | $8,224 | $608,700 | $262,000 | $346,700 |
| 2023 | $7,949 | $559,400 | $249,600 | $309,800 |
| 2022 | $7,774 | $535,400 | $238,900 | $296,500 |
| 2021 | $7,503 | $509,000 | $217,200 | $291,800 |
| 2020 | $7,276 | $499,400 | $217,200 | $282,200 |
| 2019 | $6,909 | $470,000 | $206,800 | $263,200 |
| 2018 | $6,505 | $462,800 | $206,800 | $256,000 |
| 2017 | $6,505 | $432,500 | $193,200 | $239,300 |
| 2016 | $6,227 | $420,200 | $186,100 | $234,100 |
| 2015 | $6,120 | $402,900 | $157,100 | $245,800 |
| 2014 | $5,923 | $395,100 | $154,000 | $241,100 |
Source: Public Records
Map
Nearby Homes
- 5 Lauren Ln
- 67 Morse St
- 261 East St
- 619 N Main St
- 12 Community Way
- 44 Angell St Unit 44
- 60 King St
- 28 Angell St
- 25 Winter St
- 55-57 Pine Needle Ln
- 82 Brook St
- 9 Independence Dr Unit 9
- 35 Independence Dr Unit 35
- 409 Pratt St
- 99 Pleasant St
- 22 Pleasant St Unit A
- 22 Pleasant St Unit B
- 3 Cushing Ln
- 132 Cannon Forge Dr
- 170 Cannon Forge Dr