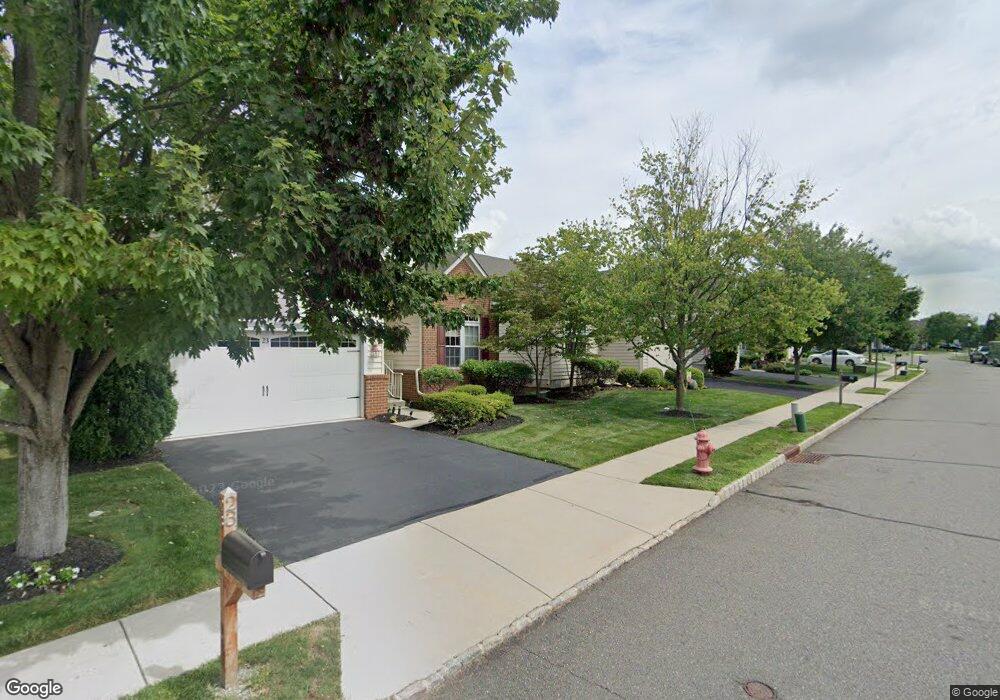
21 Thornton St Hillsborough, NJ 08844
Estimated Value: $604,784 - $690,000
--
Bed
--
Bath
1,854
Sq Ft
$359/Sq Ft
Est. Value
About This Home
This home is located at 21 Thornton St, Hillsborough, NJ 08844 and is currently estimated at $664,696, approximately $358 per square foot. 21 Thornton St is a home located in Somerset County with nearby schools including Hillsborough High School.
Ownership History
Date
Name
Owned For
Owner Type
Purchase Details
Closed on
May 13, 2015
Sold by
Maiolo Vincent F and Maiolo Pamela A
Bought by
Maiolo Living Trust and Maiolo Pamela A
Current Estimated Value
Purchase Details
Closed on
Oct 16, 2008
Sold by
Nvr Inc
Bought by
Maiolo Vincent F and Maiolo Pamela A
Home Financials for this Owner
Home Financials are based on the most recent Mortgage that was taken out on this home.
Original Mortgage
$65,000
Outstanding Balance
$43,182
Interest Rate
6.41%
Mortgage Type
Purchase Money Mortgage
Estimated Equity
$621,514
Purchase Details
Closed on
Jul 9, 2008
Sold by
Atlantic Equity Westmeade Llc
Bought by
Nvr Inc
Create a Home Valuation Report for This Property
The Home Valuation Report is an in-depth analysis detailing your home's value as well as a comparison with similar homes in the area
Home Values in the Area
Average Home Value in this Area
Purchase History
| Date | Buyer | Sale Price | Title Company |
|---|---|---|---|
| Maiolo Living Trust | -- | Attorney | |
| Maiolo Vincent F | $437,990 | Multiple | |
| Nvr Inc | $187,500 | Title America Agency Corp |
Source: Public Records
Mortgage History
| Date | Status | Borrower | Loan Amount |
|---|---|---|---|
| Open | Maiolo Vincent F | $65,000 |
Source: Public Records
Tax History Compared to Growth
Tax History
| Year | Tax Paid | Tax Assessment Tax Assessment Total Assessment is a certain percentage of the fair market value that is determined by local assessors to be the total taxable value of land and additions on the property. | Land | Improvement |
|---|---|---|---|---|
| 2025 | $11,090 | $571,000 | $281,500 | $289,500 |
| 2024 | $11,090 | $517,500 | $246,500 | $271,000 |
| 2023 | $10,048 | $466,700 | $236,500 | $230,200 |
| 2022 | $9,890 | $442,900 | $211,500 | $231,400 |
| 2021 | $9,003 | $394,100 | $161,500 | $232,600 |
| 2020 | $9,188 | $385,400 | $151,500 | $233,900 |
| 2019 | $9,368 | $389,700 | $146,500 | $243,200 |
| 2018 | $9,301 | $384,500 | $136,500 | $248,000 |
| 2017 | $9,213 | $381,500 | $131,500 | $250,000 |
| 2016 | $8,963 | $371,300 | $131,500 | $239,800 |
| 2015 | $8,452 | $365,000 | $131,500 | $233,500 |
| 2014 | $8,215 | $362,700 | $131,500 | $231,200 |
Source: Public Records
Map
Nearby Homes