Estimated Value: $168,000 - $238,000
3
Beds
1
Bath
1,152
Sq Ft
$169/Sq Ft
Est. Value
About This Home
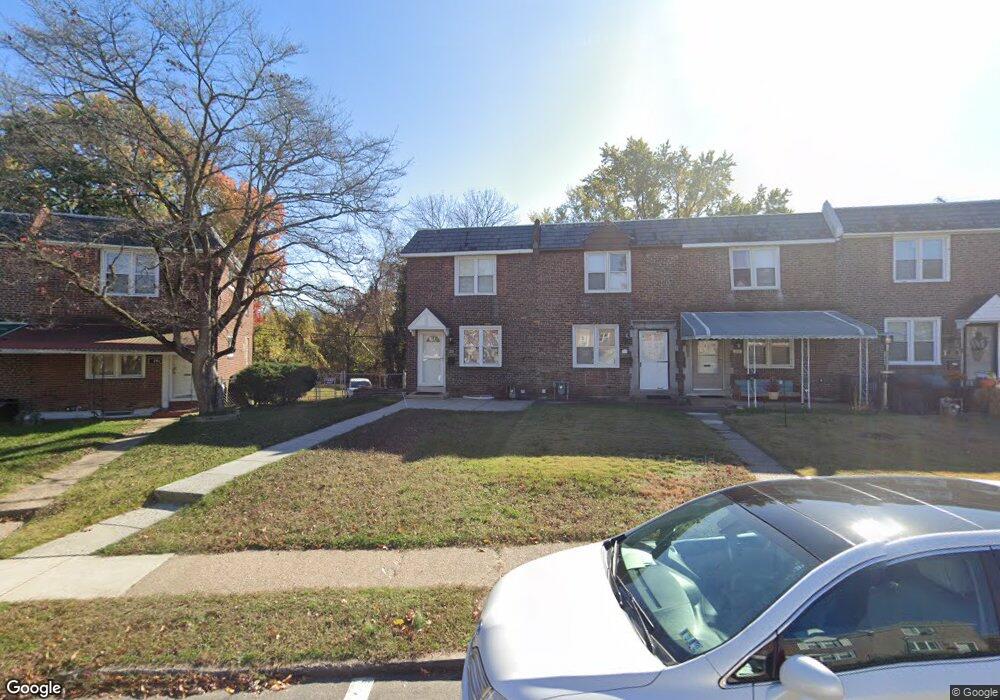
This home is located at 21 W Lynbrook Rd, Darby, PA 19023 and is currently estimated at $194,227, approximately $168 per square foot. 21 W Lynbrook Rd is a home located in Delaware County with nearby schools including Harris School, Academy Park High School, and Blessed Virgin Mary School.
Ownership History
Date
Name
Owned For
Owner Type
Purchase Details
Closed on
Aug 20, 2020
Sold by
Lee Michelle C
Bought by
Branin Christopher and Branin Jill
Current Estimated Value
Home Financials for this Owner
Home Financials are based on the most recent Mortgage that was taken out on this home.
Original Mortgage
$61,200
Outstanding Balance
$42,872
Interest Rate
2.4%
Mortgage Type
New Conventional
Estimated Equity
$151,355
Purchase Details
Closed on
Jun 14, 2010
Sold by
Smith David P and Smith Tracy D
Bought by
Lee Michelle C
Home Financials for this Owner
Home Financials are based on the most recent Mortgage that was taken out on this home.
Original Mortgage
$94,724
Interest Rate
5.03%
Mortgage Type
FHA
Purchase Details
Closed on
May 14, 2004
Sold by
Popowicz John M and Popowicz Christine A
Bought by
Smith David P and Smith Tracy D
Home Financials for this Owner
Home Financials are based on the most recent Mortgage that was taken out on this home.
Original Mortgage
$84,500
Interest Rate
5.94%
Mortgage Type
Stand Alone First
Create a Home Valuation Report for This Property
The Home Valuation Report is an in-depth analysis detailing your home's value as well as a comparison with similar homes in the area
Home Values in the Area
Average Home Value in this Area
Purchase History
| Date | Buyer | Sale Price | Title Company |
|---|---|---|---|
| Branin Christopher | $81,600 | Sienna Abstract | |
| Lee Michelle C | $96,000 | None Available | |
| Smith David P | $79,000 | Fidelity National Title Insu |
Source: Public Records
Mortgage History
| Date | Status | Borrower | Loan Amount |
|---|---|---|---|
| Open | Branin Christopher | $61,200 | |
| Previous Owner | Lee Michelle C | $94,724 | |
| Previous Owner | Smith David P | $84,500 |
Source: Public Records
Tax History Compared to Growth
Tax History
| Year | Tax Paid | Tax Assessment Tax Assessment Total Assessment is a certain percentage of the fair market value that is determined by local assessors to be the total taxable value of land and additions on the property. | Land | Improvement |
|---|---|---|---|---|
| 2025 | $3,869 | $85,430 | $22,000 | $63,430 |
| 2024 | $3,869 | $85,430 | $22,000 | $63,430 |
| 2023 | $3,766 | $85,430 | $22,000 | $63,430 |
| 2022 | $3,623 | $85,430 | $22,000 | $63,430 |
| 2021 | $4,990 | $85,430 | $22,000 | $63,430 |
| 2020 | $3,579 | $56,310 | $15,890 | $40,420 |
| 2019 | $3,450 | $56,310 | $15,890 | $40,420 |
| 2018 | $3,374 | $56,310 | $0 | $0 |
| 2017 | $3,311 | $56,310 | $0 | $0 |
| 2016 | $309 | $56,310 | $0 | $0 |
| 2015 | $309 | $56,310 | $0 | $0 |
| 2014 | $309 | $56,310 | $0 | $0 |
Source: Public Records
Map
Nearby Homes
- 1008 Springfield Rd
- 4 Creek Ave
- 1007 Tyler Ave
- 113 Hillside Ave
- 134 S Macdade Blvd
- 112 Pusey Ave
- 212 Pusey Ave
- 17 Kern St
- 1044 Pine St
- 221 Highland Ave
- 1017 Lawrence Ave
- 1115 Chestnut St
- 411 Chester Pike
- 1143 Chestnut St
- 28 S 12th St
- 14 N Macdade Blvd
- 418 Pusey Ave Unit 95
- 209 Pusey Ave
- 439 Beechwood Ave
- 1125 Main St
- 19 E Lynbrook Rd
- 23 E Lynbrook Rd
- 25 E Lynbrook Rd
- 17 E Lynbrook Rd
- 27 E Lynbrook Rd
- 15 E Lynbrook Rd
- 29 E Lynbrook Rd
- 13 E Lynbrook Rd
- 31 E Lynbrook Rd
- 11 E Lynbrook Rd
- 33 E Lynbrook Rd
- 9 E Lynbrook Rd
- 35 E Lynbrook Rd
- 24 E Lynbrook Rd
- 28 E Lynbrook Rd
- 30 E Lynbrook Rd
- 1024 S Lynbrook Rd
- 1024 Springfield Rd
- 1026 S Lynbrook Rd
- 1031 S Lynbrook Rd