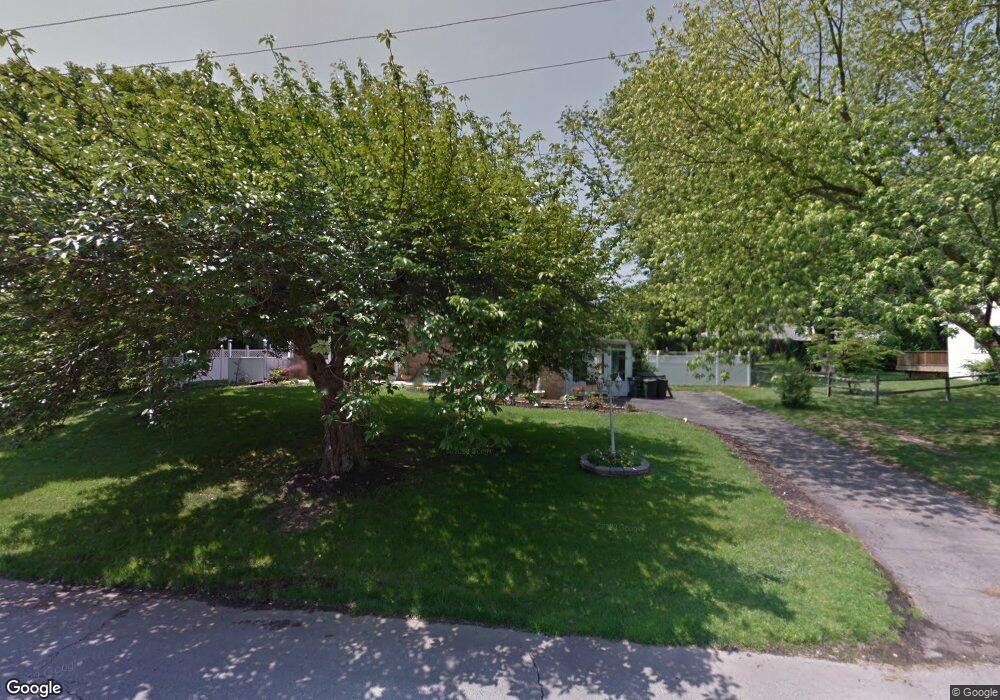
210 Governors Dr Wallingford, PA 19086
Estimated Value: $589,000 - $778,953
3
Beds
2
Baths
3,432
Sq Ft
$201/Sq Ft
Est. Value
About This Home
This home is located at 210 Governors Dr, Wallingford, PA 19086 and is currently estimated at $688,488, approximately $200 per square foot. 210 Governors Dr is a home located in Delaware County with nearby schools including Swarthmore-Rutledge School, Strath Haven Middle School, and Strath Haven High School.
Ownership History
Date
Name
Owned For
Owner Type
Purchase Details
Closed on
Jul 28, 2006
Sold by
Bennett Thomas J and Spence Diane M
Bought by
Bennett Thomas J
Current Estimated Value
Home Financials for this Owner
Home Financials are based on the most recent Mortgage that was taken out on this home.
Original Mortgage
$260,000
Outstanding Balance
$150,603
Interest Rate
6.12%
Mortgage Type
Stand Alone Refi Refinance Of Original Loan
Estimated Equity
$537,885
Purchase Details
Closed on
Jun 15, 2001
Sold by
Sierer William R and Mcnulty Esq Anthony J
Bought by
Bennett Thomas J and Spence Diane M
Home Financials for this Owner
Home Financials are based on the most recent Mortgage that was taken out on this home.
Original Mortgage
$145,994
Interest Rate
7.09%
Create a Home Valuation Report for This Property
The Home Valuation Report is an in-depth analysis detailing your home's value as well as a comparison with similar homes in the area
Home Values in the Area
Average Home Value in this Area
Purchase History
| Date | Buyer | Sale Price | Title Company |
|---|---|---|---|
| Bennett Thomas J | -- | Accommodation | |
| Bennett Thomas J | $182,500 | -- |
Source: Public Records
Mortgage History
| Date | Status | Borrower | Loan Amount |
|---|---|---|---|
| Open | Bennett Thomas J | $260,000 | |
| Closed | Bennett Thomas J | $145,994 |
Source: Public Records
Tax History Compared to Growth
Tax History
| Year | Tax Paid | Tax Assessment Tax Assessment Total Assessment is a certain percentage of the fair market value that is determined by local assessors to be the total taxable value of land and additions on the property. | Land | Improvement |
|---|---|---|---|---|
| 2025 | $16,357 | $458,800 | $113,680 | $345,120 |
| 2024 | $16,357 | $458,800 | $113,680 | $345,120 |
| 2023 | $15,717 | $458,800 | $113,680 | $345,120 |
| 2022 | $15,383 | $458,800 | $113,680 | $345,120 |
| 2021 | $24,991 | $458,800 | $113,680 | $345,120 |
| 2020 | $9,475 | $163,500 | $61,880 | $101,620 |
| 2019 | $9,213 | $163,500 | $61,880 | $101,620 |
| 2018 | $9,035 | $163,500 | $0 | $0 |
| 2017 | $8,786 | $163,500 | $0 | $0 |
| 2016 | $897 | $151,210 | $0 | $0 |
| 2015 | $830 | $151,210 | $0 | $0 |
| 2014 | $830 | $151,210 | $0 | $0 |
Source: Public Records
Map
Nearby Homes
- 800 Avondale Rd Unit 7N
- 800 Avondale Rd Unit 7P
- 800 Avondale Rd Unit 7B
- 700 Avondale Rd Unit 3J
- 700 Avondale Rd Unit 7C
- 102 Harvey Rd Unit 1P
- 102 Harvey Rd Unit 1A
- 102 Harvey Rd Unit 1BM
- 102 Harvey Rd Unit 1B
- 1412 Donna Ave
- 319 Fairview Rd
- 525 Kelly Ave
- 1614 Blackrock Rd
- 802 Fairview Rd
- 732 E 25th St
- 1115 7th Ave
- 21 Berkshire Dr
- 290 Morris Ave
- 1126 Grant Ave
- 126 Youngs Ave
- 212 Governors Dr
- 208 Governors Dr
- 129 Westminster Dr
- 209 Governors Dr
- 3 Arthur Ct
- 211 Governors Dr
- 4 Arthur Ct
- 206 Governors Dr
- 207 Governors Dr
- 213 Governors Dr
- 300 Governors Dr
- 127 Westminster Dr
- 214 Stanford Dr
- 216 Stanford Dr
- 204 Governors Dr
- 205 Governors Dr
- 130 Westminster Dr
- 212 Stanford Dr
- 2 Arthur Ct
- 218 Stanford Dr