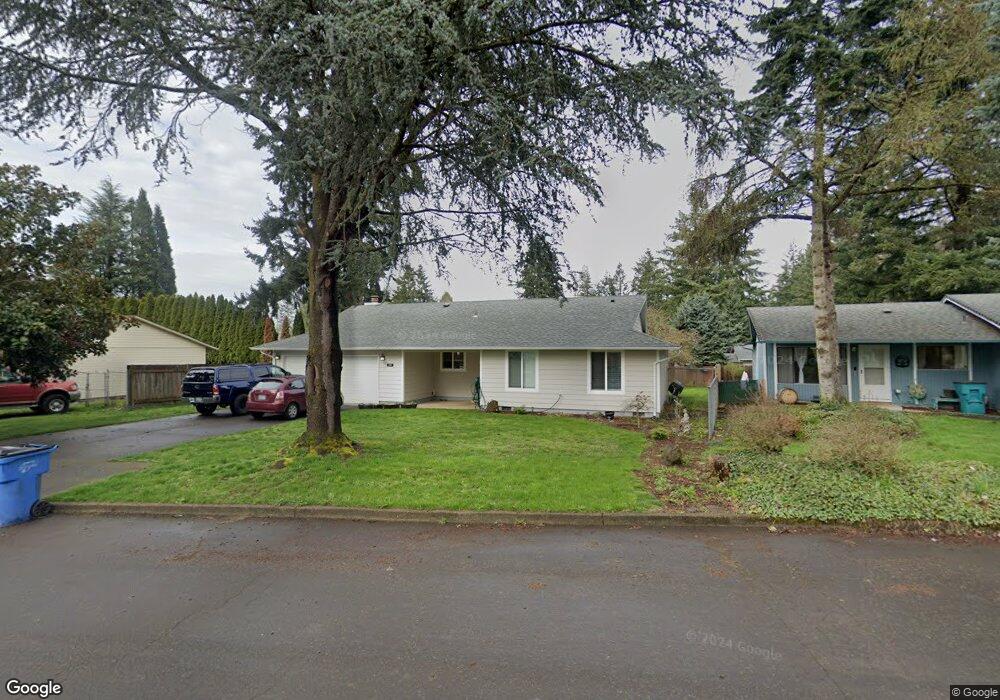
210 NE 149th Ave Unit 1 Vancouver, WA 98684
Estimated Value: $457,000 - $464,178
3
Beds
2
Baths
1,312
Sq Ft
$351/Sq Ft
Est. Value
About This Home
This home is located at 210 NE 149th Ave Unit 1, Vancouver, WA 98684 and is currently estimated at $460,795, approximately $351 per square foot. 210 NE 149th Ave Unit 1 is a home located in Clark County with nearby schools including Hearthwood Elementary School, Cascade Middle School, and Evergreen High School.
Ownership History
Date
Name
Owned For
Owner Type
Purchase Details
Closed on
Jul 24, 2020
Sold by
Kostadinov Ivan
Bought by
Root Noah B and Root Karina L
Current Estimated Value
Home Financials for this Owner
Home Financials are based on the most recent Mortgage that was taken out on this home.
Original Mortgage
$347,700
Interest Rate
2.9%
Mortgage Type
New Conventional
Purchase Details
Closed on
Nov 21, 2016
Sold by
Stevens Tania I
Bought by
Kostadinov Ivan
Purchase Details
Closed on
Oct 20, 2009
Sold by
Stevens Tania I
Bought by
Stevens Tania I and Kostadinov Ivan N
Purchase Details
Closed on
Sep 7, 2009
Sold by
Kostadinor Ivan N
Bought by
Stevens Tania I
Purchase Details
Closed on
Oct 16, 2002
Sold by
Brown James
Bought by
Kostadinov Ivan N
Home Financials for this Owner
Home Financials are based on the most recent Mortgage that was taken out on this home.
Original Mortgage
$130,853
Interest Rate
6.05%
Create a Home Valuation Report for This Property
The Home Valuation Report is an in-depth analysis detailing your home's value as well as a comparison with similar homes in the area
Home Values in the Area
Average Home Value in this Area
Purchase History
| Date | Buyer | Sale Price | Title Company |
|---|---|---|---|
| Root Noah B | $366,000 | Chicago Title Company Of Wa | |
| Kostadinov Ivan | -- | None Available | |
| Stevens Tania I | -- | None Available | |
| Stevens Tania I | -- | None Available | |
| Kostadinov Ivan N | $134,900 | Stewart Title |
Source: Public Records
Mortgage History
| Date | Status | Borrower | Loan Amount |
|---|---|---|---|
| Previous Owner | Root Noah B | $347,700 | |
| Previous Owner | Kostadinov Ivan N | $130,853 |
Source: Public Records
Tax History Compared to Growth
Tax History
| Year | Tax Paid | Tax Assessment Tax Assessment Total Assessment is a certain percentage of the fair market value that is determined by local assessors to be the total taxable value of land and additions on the property. | Land | Improvement |
|---|---|---|---|---|
| 2025 | $4,044 | $421,686 | $188,500 | $233,186 |
| 2024 | $4,036 | $407,546 | $188,500 | $219,046 |
| 2023 | $4,021 | $421,866 | $192,850 | $229,016 |
| 2022 | $3,633 | $415,338 | $192,850 | $222,488 |
| 2021 | $3,348 | $355,966 | $165,300 | $190,666 |
| 2020 | $3,043 | $310,004 | $145,000 | $165,004 |
| 2019 | $2,685 | $284,485 | $125,450 | $159,035 |
| 2018 | $2,913 | $270,261 | $0 | $0 |
| 2017 | $2,557 | $235,703 | $0 | $0 |
| 2016 | $2,347 | $214,194 | $0 | $0 |
| 2015 | $2,230 | $188,226 | $0 | $0 |
| 2014 | -- | $170,989 | $0 | $0 |
| 2013 | -- | $162,911 | $0 | $0 |
Source: Public Records
Map
Nearby Homes
- 14517 NE Douglas Fir Ct
- 106 SE 152nd Ave
- 405 NE 152nd Ave
- 404 SE 150th Ct
- 15102 SE 5th St
- 714 NE 152nd Ave
- 713 NE 152nd Ave
- 604 NE 156th Ave
- 14511 SE 7th Way
- 14308 SE 7th Way
- 15807 NE 2nd St
- 510 SE 157th Ave Unit 37
- 522 SE 157th Ave Unit 14
- 15813 SE 1st St
- 14414 SE 8th St
- 1107 NE 147th Ave
- 551 NE 137th Ave
- 14415 SE 9th St
- 712 NE 138th Place
- 15509 SE Mill Plain Blvd Unit 43
- 210 NE 149th Ave
- 214 NE 149th Ave
- 206 NE 149th Ave
- 14810 NE 2nd St
- 213 NE 148th Ave
- 219 NE 148th Ave
- 218 NE 149th Ave
- 14804 NE 2nd St
- 211 NE 149th Ave
- 209 NE 149th Ave
- 225 NE 148th Ave
- 14900 NE 3rd St
- 14904 NE 2nd St
- 14909 NE 3rd St
- 14904 NE 3rd St
- 231 NE 148th Ave
- 14811 NE 2nd St
- 14817 NE 2nd St
- 210 NE 148th Ave
- 214 NE 148th Ave