2101 SW Chinquapin Ave Bentonville, AR 72712
Estimated Value: $528,000 - $575,000
5
Beds
3
Baths
2,673
Sq Ft
$207/Sq Ft
Est. Value
About This Home
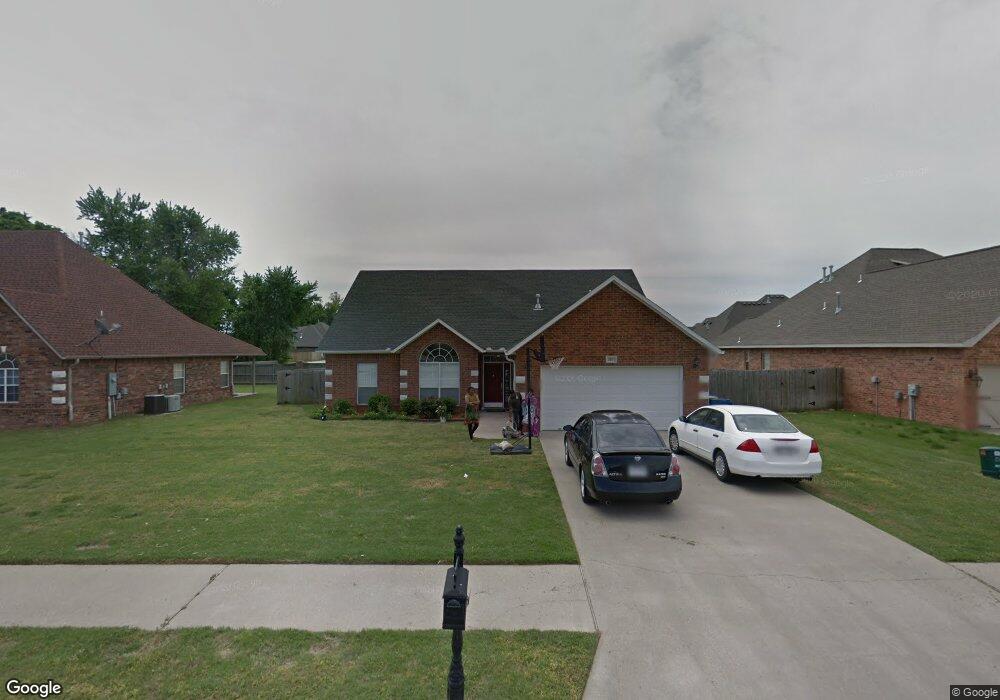
This home is located at 2101 SW Chinquapin Ave, Bentonville, AR 72712 and is currently estimated at $554,081, approximately $207 per square foot. 2101 SW Chinquapin Ave is a home located in Benton County with nearby schools including Bright Field Middle School, Willowbrook Elementary School, and Fulbright Junior High School.
Ownership History
Date
Name
Owned For
Owner Type
Purchase Details
Closed on
Apr 22, 2009
Sold by
Federal Home Loan Mortgage Corporation
Bought by
Kondamuri Uma M
Current Estimated Value
Home Financials for this Owner
Home Financials are based on the most recent Mortgage that was taken out on this home.
Original Mortgage
$184,500
Outstanding Balance
$115,249
Interest Rate
4.72%
Estimated Equity
$438,832
Purchase Details
Closed on
Dec 2, 2008
Sold by
Johnson Stephanie L and Johnson Christopher S
Bought by
Federal Home Loan Mortgage Corp
Purchase Details
Closed on
Oct 16, 2006
Sold by
Tommy Walker Construction Inc
Bought by
Johnson Christopher Stephen and Johnson Stephanie Lynn
Home Financials for this Owner
Home Financials are based on the most recent Mortgage that was taken out on this home.
Original Mortgage
$239,800
Interest Rate
6.87%
Purchase Details
Closed on
Sep 16, 2004
Bought by
Simeon Inv 14P
Create a Home Valuation Report for This Property
The Home Valuation Report is an in-depth analysis detailing your home's value as well as a comparison with similar homes in the area
Home Values in the Area
Average Home Value in this Area
Purchase History
| Date | Buyer | Sale Price | Title Company |
|---|---|---|---|
| Kondamuri Uma M | $103,000 | Associates Closing & Title | |
| Federal Home Loan Mortgage Corp | $236,000 | None Available | |
| Johnson Christopher Stephen | $240,000 | Realty Title Rogers | |
| Simeon Inv 14P | $553,000 | -- |
Source: Public Records
Mortgage History
| Date | Status | Borrower | Loan Amount |
|---|---|---|---|
| Open | Kondamuri Uma M | $184,500 | |
| Previous Owner | Johnson Christopher Stephen | $239,800 |
Source: Public Records
Tax History Compared to Growth
Tax History
| Year | Tax Paid | Tax Assessment Tax Assessment Total Assessment is a certain percentage of the fair market value that is determined by local assessors to be the total taxable value of land and additions on the property. | Land | Improvement |
|---|---|---|---|---|
| 2025 | $3,854 | $88,116 | $14,000 | $74,116 |
| 2024 | $3,696 | $88,116 | $14,000 | $74,116 |
| 2023 | $3,520 | $58,020 | $8,000 | $50,020 |
| 2022 | $3,073 | $58,020 | $8,000 | $50,020 |
| 2021 | $2,905 | $58,020 | $8,000 | $50,020 |
| 2020 | $2,779 | $49,510 | $8,400 | $41,110 |
| 2019 | $2,779 | $49,510 | $8,400 | $41,110 |
| 2018 | $2,711 | $49,510 | $8,400 | $41,110 |
| 2017 | $2,357 | $49,510 | $8,400 | $41,110 |
| 2016 | $2,357 | $49,510 | $8,400 | $41,110 |
| 2015 | $2,583 | $41,790 | $6,000 | $35,790 |
| 2014 | $2,233 | $41,790 | $6,000 | $35,790 |
Source: Public Records
Map
Nearby Homes
- 2303 SW Chinquapin Ave
- 1812 SW Edinburgh Ave
- 4508 SW Birmingham St
- 2402 SW Aster Way
- 2508 SW Nottingham Ave
- 1602 SW Montrose Ave
- 4605 SW Barton St
- 1813 SW Pine Ave
- 4004 SW Banbury Dr
- 4203 SW Lilac St
- 2603 SW Hampton Ave
- 2904 SW Little Elm Loop
- 4601 SW Hollowbrook St
- 1204 SW Edinburgh Ave
- 3200 SW Rosemont Ave
- 1300 SW Willow Bend Ave
- 4804 SW Scarlet Oak St
- 1104 SW Edinburgh Ave
- 3107 SW Sandalwood Ave
- 4903 SW Newcastle Rd
- 2103 SW Chinquapin Ave
- 2100 SW Nottingham Ave
- 2105 SW Chinquapin Ave
- 2001 SW Pinoak Ave
- 2001 SW Chinquapin Ave
- 2102 SW Nottingham Ave
- 2000 SW Nutmeg St
- 2000 SW Pinoak Ave
- 4400 SW Bright Rd
- 2003 SW Pinoak Ave
- 2104 SW Nottingham Ave
- Lot 47 SW Chancery St
- 2002 SW Nutmeg St
- 4500 SW Chancery St
- 2002 SW Pinoak Ave
- 2201 SW Chinquapin Ave
- 2005 SW Pinoak Ave
- 4501 SW Branch St
- 4501 SW Chancery St
- 0 4501chancery Rd Unit 582123