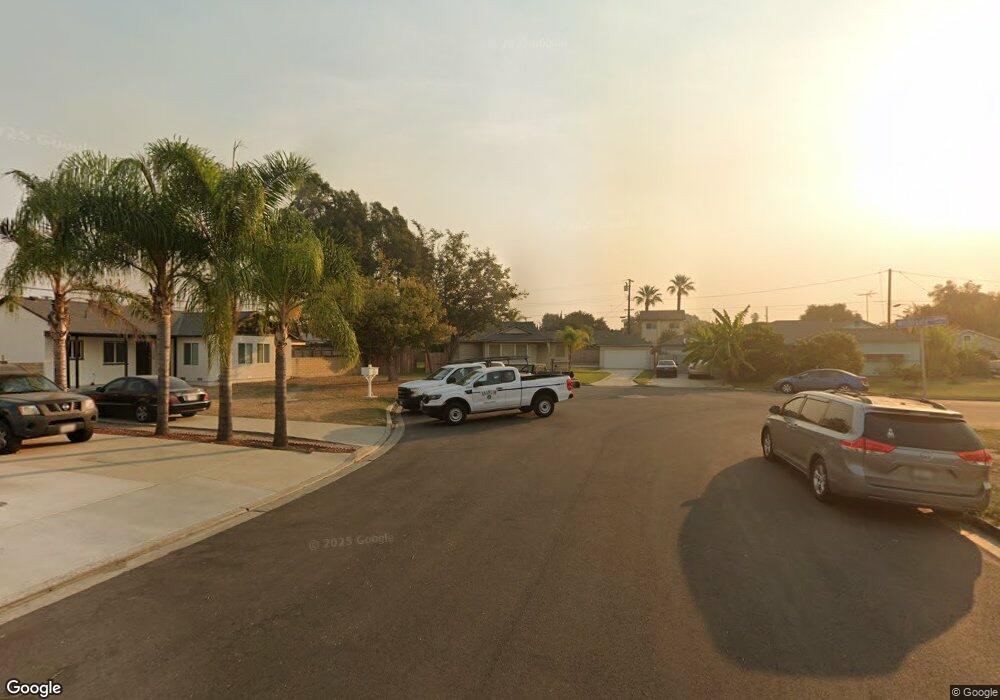
2101 W Lullaby Ln Anaheim, CA 92804
West Anaheim NeighborhoodEstimated Value: $850,000 - $962,000
3
Beds
2
Baths
1,275
Sq Ft
$710/Sq Ft
Est. Value
About This Home
This home is located at 2101 W Lullaby Ln, Anaheim, CA 92804 and is currently estimated at $905,366, approximately $710 per square foot. 2101 W Lullaby Ln is a home located in Orange County with nearby schools including James Madison Elementary School, Ball Junior High School, and Loara High School.
Ownership History
Date
Name
Owned For
Owner Type
Purchase Details
Closed on
Jun 26, 2025
Sold by
Hester Mark C
Bought by
Hester Mark C and Hester Nashauna
Current Estimated Value
Home Financials for this Owner
Home Financials are based on the most recent Mortgage that was taken out on this home.
Original Mortgage
$550,000
Outstanding Balance
$549,061
Interest Rate
6.81%
Mortgage Type
New Conventional
Estimated Equity
$356,305
Purchase Details
Closed on
Sep 30, 2009
Sold by
Hester Nashauna
Bought by
Hester Mark C
Home Financials for this Owner
Home Financials are based on the most recent Mortgage that was taken out on this home.
Original Mortgage
$180,500
Interest Rate
4.83%
Mortgage Type
New Conventional
Purchase Details
Closed on
May 30, 2001
Sold by
Larson Bryan J and Larson Tamra L
Bought by
Hester Mark C
Home Financials for this Owner
Home Financials are based on the most recent Mortgage that was taken out on this home.
Original Mortgage
$180,000
Interest Rate
7.09%
Create a Home Valuation Report for This Property
The Home Valuation Report is an in-depth analysis detailing your home's value as well as a comparison with similar homes in the area
Home Values in the Area
Average Home Value in this Area
Purchase History
| Date | Buyer | Sale Price | Title Company |
|---|---|---|---|
| Hester Mark C | -- | Rocket Close And Title, Inc | |
| Hester Mark C | -- | Fidelity National Title | |
| Hester Mark C | $244,000 | Lawyers Title Company |
Source: Public Records
Mortgage History
| Date | Status | Borrower | Loan Amount |
|---|---|---|---|
| Open | Hester Mark C | $550,000 | |
| Previous Owner | Hester Mark C | $180,500 | |
| Previous Owner | Hester Mark C | $180,000 |
Source: Public Records
Tax History Compared to Growth
Tax History
| Year | Tax Paid | Tax Assessment Tax Assessment Total Assessment is a certain percentage of the fair market value that is determined by local assessors to be the total taxable value of land and additions on the property. | Land | Improvement |
|---|---|---|---|---|
| 2025 | $4,197 | $360,447 | $288,364 | $72,083 |
| 2024 | $4,197 | $353,380 | $282,710 | $70,670 |
| 2023 | $4,107 | $346,451 | $277,166 | $69,285 |
| 2022 | $4,052 | $339,658 | $271,731 | $67,927 |
| 2021 | $4,056 | $332,999 | $266,403 | $66,596 |
| 2020 | $4,038 | $329,585 | $263,671 | $65,914 |
| 2019 | $3,919 | $323,123 | $258,501 | $64,622 |
| 2018 | $3,837 | $316,788 | $253,433 | $63,355 |
| 2017 | $3,687 | $310,577 | $248,464 | $62,113 |
| 2016 | $3,675 | $304,488 | $243,592 | $60,896 |
| 2015 | $3,641 | $299,915 | $239,933 | $59,982 |
| 2014 | $3,418 | $294,041 | $235,233 | $58,808 |
Source: Public Records
Map
Nearby Homes
- 1350 S Ashington Ln
- 1944 W Lullaby Ln
- 1250 S Brookhurst St Unit 1059
- 1250 S Brookhurst St Unit 2028
- 1250 S Brookhurst St Unit 2080
- 1250 S Brookhurst St
- 1250 S Brookhurst St Unit 2033
- 10301 Antigua St
- 1737 S Garden Dr
- 2011 W Katella Ave Unit 61
- 10301 Rhiems Rd
- 1765 S Biscayne Ct
- 930 S Emerald St
- 10112 Becca Dr
- 994 S Sutter Creek Rd Unit 60
- 938 S Sutter Creek Rd Unit 54
- 917 S Sutter Creek Rd Unit 46
- 1913 W Beacon Ave
- 998 S Crossbow Ln Unit 12D
- 1700 W Cerritos Ave Unit 216
- 2105 W Lullaby Ln
- 1439 S Dallas Dr
- 1435 S Dallas Dr
- 1444 S Whitegate Rd
- 2104 W Harriet Ln
- 1445 S Dallas Dr
- 2100 W Harriet Ln
- 1450 S Whitegate Rd
- 1449 S Dallas Dr
- 2108 W Harriet Ln
- 1447 S Whitegate Rd
- 1427 S Dallas Dr
- 2111 W Lullaby Ln
- 1975 W Lullaby Ln
- 2112 W Harriet Ln
- 1455 S Dallas Dr
- 1456 S Whitegate Rd
- 1451 S Whitegate Rd
- 1974 W Harriet Ln
- 2101 W Harriet Ln