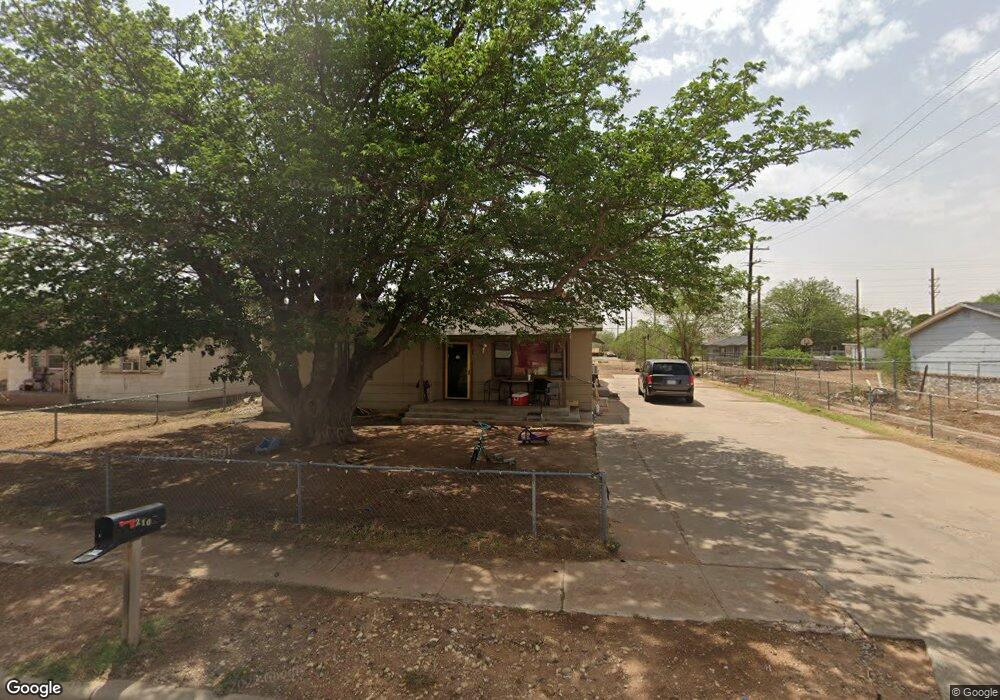
2102 Elm Ave Lubbock, TX 79404
Chatman Hill NeighborhoodEstimated Value: $117,000 - $155,000
3
Beds
2
Baths
2,212
Sq Ft
$62/Sq Ft
Est. Value
About This Home
This home is located at 2102 Elm Ave, Lubbock, TX 79404 and is currently estimated at $136,386, approximately $61 per square foot. 2102 Elm Ave is a home located in Lubbock County with nearby schools including Estacado High School, Ervin Elementary School, and Betty M. Condra School for Education Innovation.
Ownership History
Date
Name
Owned For
Owner Type
Purchase Details
Closed on
Jan 5, 2010
Sold by
Secretary Of Housing & Urban Development
Bought by
Dailey Darrell D
Current Estimated Value
Home Financials for this Owner
Home Financials are based on the most recent Mortgage that was taken out on this home.
Original Mortgage
$33,200
Interest Rate
4.8%
Mortgage Type
Purchase Money Mortgage
Purchase Details
Closed on
Jul 31, 2009
Sold by
Midfirst Bank
Bought by
The Secretary Of Housing & Urban Develop
Purchase Details
Closed on
Jul 7, 2009
Sold by
Shaw Michelle and Shaw Joe Glenn
Bought by
Midfirst Bank
Purchase Details
Closed on
Aug 25, 2006
Sold by
Harmon Paul
Bought by
Shaw Joe Glenn
Home Financials for this Owner
Home Financials are based on the most recent Mortgage that was taken out on this home.
Original Mortgage
$78,764
Interest Rate
6.72%
Mortgage Type
FHA
Create a Home Valuation Report for This Property
The Home Valuation Report is an in-depth analysis detailing your home's value as well as a comparison with similar homes in the area
Home Values in the Area
Average Home Value in this Area
Purchase History
| Date | Buyer | Sale Price | Title Company |
|---|---|---|---|
| Dailey Darrell D | -- | None Available | |
| The Secretary Of Housing & Urban Develop | -- | None Available | |
| Midfirst Bank | $83,997 | None Available | |
| Shaw Joe Glenn | -- | None Available |
Source: Public Records
Mortgage History
| Date | Status | Borrower | Loan Amount |
|---|---|---|---|
| Closed | Dailey Darrell D | $33,200 | |
| Previous Owner | Shaw Joe Glenn | $78,764 |
Source: Public Records
Tax History Compared to Growth
Tax History
| Year | Tax Paid | Tax Assessment Tax Assessment Total Assessment is a certain percentage of the fair market value that is determined by local assessors to be the total taxable value of land and additions on the property. | Land | Improvement |
|---|---|---|---|---|
| 2025 | $1,947 | $128,651 | -- | -- |
| 2024 | $1,947 | $142,647 | $500 | $142,147 |
| 2023 | $1,661 | $89,341 | $500 | $88,841 |
| 2022 | $1,809 | $89,341 | $500 | $88,841 |
| 2021 | $1,619 | $75,612 | $500 | $75,112 |
| 2020 | $1,293 | $59,458 | $500 | $58,958 |
| 2019 | $1,027 | $45,728 | $500 | $45,228 |
| 2018 | $1,028 | $45,728 | $500 | $45,228 |
| 2017 | $1,029 | $45,728 | $500 | $45,228 |
| 2016 | $1,029 | $45,728 | $500 | $45,228 |
| 2015 | $1,002 | $45,041 | $500 | $44,541 |
| 2014 | $1,002 | $45,041 | $500 | $44,541 |
Source: Public Records
Map
Nearby Homes