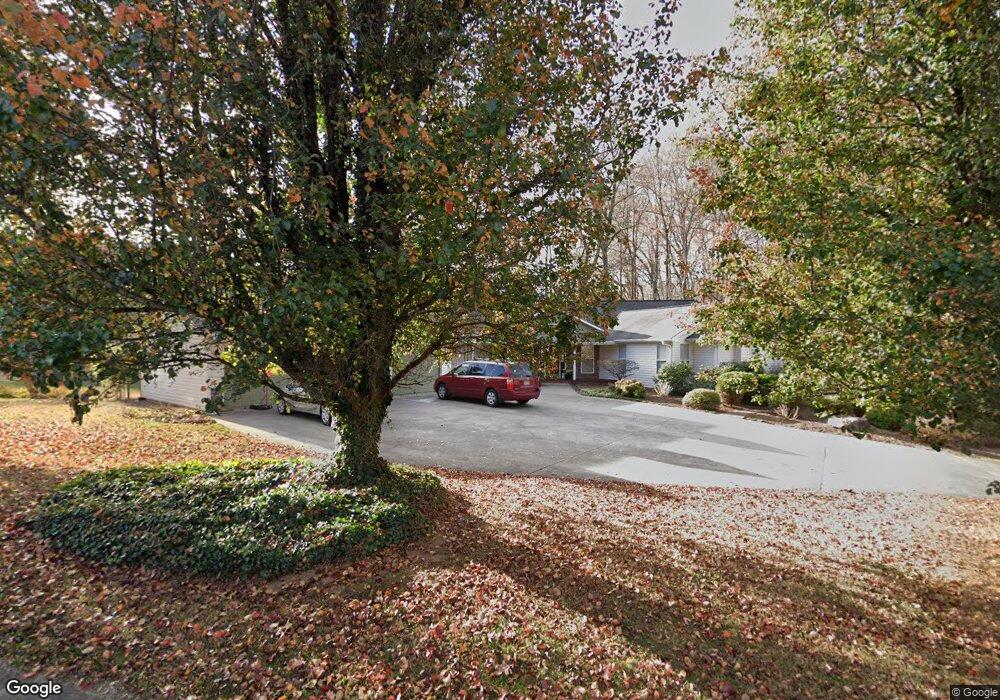
2102 J V Ledford Rd Young Harris, GA 30582
Estimated Value: $593,764 - $848,000
5
Beds
5
Baths
3,435
Sq Ft
$202/Sq Ft
Est. Value
About This Home
This home is located at 2102 J V Ledford Rd, Young Harris, GA 30582 and is currently estimated at $692,441, approximately $201 per square foot. 2102 J V Ledford Rd is a home located in Towns County with nearby schools including Towns County Elementary School, Towns County Middle School, and Towns County High School.
Ownership History
Date
Name
Owned For
Owner Type
Purchase Details
Closed on
Jun 14, 2023
Sold by
Kelley Miller Phyllis
Bought by
Hunter Matthew Ryan and Hunter Carolyn Marie
Current Estimated Value
Home Financials for this Owner
Home Financials are based on the most recent Mortgage that was taken out on this home.
Original Mortgage
$570,000
Outstanding Balance
$554,758
Interest Rate
6.39%
Mortgage Type
New Conventional
Estimated Equity
$137,683
Purchase Details
Closed on
Mar 10, 2017
Sold by
Kelley Bobby Moody
Bought by
Kelley Miller Phyllis and Miller Robert C
Purchase Details
Closed on
Mar 13, 2015
Sold by
Kelley Bobbie Moody
Bought by
Kelley Bobbie M and Kelley Miller Phyllis
Purchase Details
Closed on
Oct 20, 2006
Sold by
Dye Christopher
Bought by
Kelley Bobbie Moody
Purchase Details
Closed on
Dec 5, 2001
Sold by
Dye Christopher Ray
Bought by
Dye Christopher and Dye Jenna
Create a Home Valuation Report for This Property
The Home Valuation Report is an in-depth analysis detailing your home's value as well as a comparison with similar homes in the area
Home Values in the Area
Average Home Value in this Area
Purchase History
| Date | Buyer | Sale Price | Title Company |
|---|---|---|---|
| Hunter Matthew Ryan | $600,000 | -- | |
| Kelley Miller Phyllis | -- | -- | |
| Kelley Bobbie M | -- | -- | |
| Kelley Bobbie Moody | $355,000 | -- | |
| Dye Christopher | -- | -- |
Source: Public Records
Mortgage History
| Date | Status | Borrower | Loan Amount |
|---|---|---|---|
| Open | Hunter Matthew Ryan | $570,000 |
Source: Public Records
Tax History Compared to Growth
Tax History
| Year | Tax Paid | Tax Assessment Tax Assessment Total Assessment is a certain percentage of the fair market value that is determined by local assessors to be the total taxable value of land and additions on the property. | Land | Improvement |
|---|---|---|---|---|
| 2024 | $2,477 | $230,656 | $16,000 | $214,656 |
| 2023 | $2,359 | $201,329 | $16,000 | $185,329 |
| 2022 | $1,522 | $188,778 | $16,000 | $172,778 |
| 2021 | $1,663 | $159,504 | $16,000 | $143,504 |
| 2020 | $1,663 | $145,209 | $16,000 | $129,209 |
| 2019 | $1,800 | $138,239 | $16,000 | $122,239 |
| 2018 | $1,815 | $135,971 | $16,000 | $119,971 |
| 2017 | $1,796 | $129,875 | $16,000 | $113,875 |
| 2016 | $1,796 | $129,875 | $16,000 | $113,875 |
| 2015 | $1,819 | $129,875 | $16,000 | $113,875 |
| 2014 | $1,835 | $129,875 | $16,000 | $113,875 |
| 2013 | -- | $129,874 | $16,000 | $113,874 |
Source: Public Records
Map
Nearby Homes
- Lot 2 Coffey Ln
- LL14LT1 Coffey Ln
- LL 14 Coffey Ln
- 82 Hebron Way
- 1929 Lakeview Summit Dr
- 3259 Coffey Ln
- 3251 Holland Dr
- 3112 Allison Ln
- 2515 Leisure Ln
- 1729 Watercrest Way
- 1729 Water Crest Way
- 1727 Watercrest Way
- 1729-B Watercrest Way #B
- Tr 1&2 Holland Dr
- TR 1 & 2 Holland Dr
- TR1&2 Holland Dr
- 1725 Watercrest Way Unit D
- 1725 Water Crest Way
- 1726 Water Crest Way
- 1724 Water Crest Way
- 2103 J V Ledford Rd
- 2097 J V Ledford Rd
- 2101 J V Ledford Rd
- 2106 J V Ledford Rd
- 2214 Herman Drake Rd
- 2095 J V Ledford Rd
- 2262 Herman Drake Rd
- 2206 Herman Drake Rd
- TR3&4 Herman Drake Rd
- 2107 J V Ledford Rd
- 0 Herman Drake Rd Unit 114869
- T-2 Herman Drake Rd
- 0 Herman Drake Rd Unit 3066011
- 0 Herman Drake Rd Unit Tr 3&4 8554952
- 0 Herman Drake Rd Unit 8828514
- 0 Herman Drake Rd Unit 7164205
- 0 Herman Drake Rd Unit Tr 3&4
- 2108 J V Ledford Dr
- 45 Wildflower Ct
- 2282 Herman Drake Rd