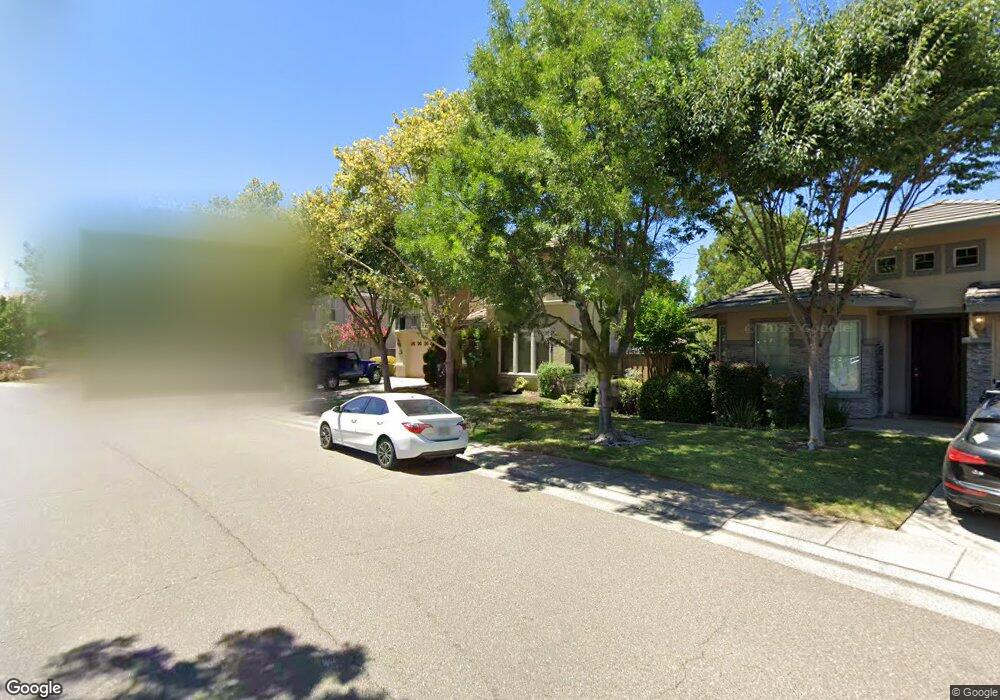
2102 Owl Meadow St Folsom, CA 95630
Empire Ranch Village NeighborhoodEstimated Value: $975,000 - $1,104,000
4
Beds
3
Baths
2,926
Sq Ft
$353/Sq Ft
Est. Value
About This Home
This home is located at 2102 Owl Meadow St, Folsom, CA 95630 and is currently estimated at $1,031,861, approximately $352 per square foot. 2102 Owl Meadow St is a home located in Sacramento County with nearby schools including Russell Ranch Elementary School, Folsom Middle School, and Vista Del Lago High School.
Ownership History
Date
Name
Owned For
Owner Type
Purchase Details
Closed on
Aug 13, 2018
Sold by
Laubach Luna Marcos and Laubach Luna Andrea A
Bought by
Laubach Luna Andrea A and Luna Marcos
Current Estimated Value
Purchase Details
Closed on
Jun 6, 2012
Sold by
Bray Joseph M and Bray Kathleen M
Bought by
Luna Marcos and Laubach Luna Andrea A
Home Financials for this Owner
Home Financials are based on the most recent Mortgage that was taken out on this home.
Original Mortgage
$392,000
Interest Rate
3.49%
Mortgage Type
New Conventional
Purchase Details
Closed on
Dec 16, 2005
Sold by
Elliott Homes Inc
Bought by
Bray Joseph M and Bray Kathleen Mh
Home Financials for this Owner
Home Financials are based on the most recent Mortgage that was taken out on this home.
Original Mortgage
$460,000
Interest Rate
6.35%
Mortgage Type
Fannie Mae Freddie Mac
Create a Home Valuation Report for This Property
The Home Valuation Report is an in-depth analysis detailing your home's value as well as a comparison with similar homes in the area
Home Values in the Area
Average Home Value in this Area
Purchase History
| Date | Buyer | Sale Price | Title Company |
|---|---|---|---|
| Laubach Luna Andrea A | -- | None Available | |
| Luna Marcos | $490,000 | None Available | |
| Bray Joseph M | $724,000 | Stewart Title Of Sacramento |
Source: Public Records
Mortgage History
| Date | Status | Borrower | Loan Amount |
|---|---|---|---|
| Previous Owner | Luna Marcos | $392,000 | |
| Previous Owner | Bray Joseph M | $460,000 |
Source: Public Records
Tax History Compared to Growth
Tax History
| Year | Tax Paid | Tax Assessment Tax Assessment Total Assessment is a certain percentage of the fair market value that is determined by local assessors to be the total taxable value of land and additions on the property. | Land | Improvement |
|---|---|---|---|---|
| 2025 | $7,921 | $603,389 | $123,138 | $480,251 |
| 2024 | $7,921 | $591,559 | $120,724 | $470,835 |
| 2023 | $7,679 | $579,960 | $118,357 | $461,603 |
| 2022 | $7,599 | $568,589 | $116,037 | $452,552 |
| 2021 | $7,528 | $557,441 | $113,762 | $443,679 |
| 2020 | $7,486 | $551,726 | $112,596 | $439,130 |
| 2019 | $7,486 | $540,909 | $110,389 | $430,520 |
| 2018 | $7,337 | $530,304 | $108,225 | $422,079 |
| 2017 | $6,944 | $519,906 | $106,103 | $413,803 |
| 2016 | $7,188 | $509,713 | $104,023 | $405,690 |
| 2015 | $6,997 | $502,058 | $102,461 | $399,597 |
| 2014 | $6,719 | $492,224 | $100,454 | $391,770 |
Source: Public Records
Map
Nearby Homes
- 600 Moon Cir Unit 626
- 600 Moon Cir Unit 627
- 1983 Misty Meadow Dr
- 300 Moon Cir Unit 331
- 1200 Moon Cir Unit 1226
- 456 Lone Spur Dr
- 1996 Stockman Cir
- 1691 Seneca Cir
- 1659 Seneca Cir
- 1723 Seneca Cir
- 1587 Seneca Cir
- 1670 Seneca Cir
- 1702 Seneca Cir
- 1710 Seneca Cir
- 1678 Seneca Cir
- 1686 Seneca Cir
- 1662 Seneca Cir
- 1654 Seneca Cir
- 1638 Seneca Cir
- 1726 Seneca Cir
- 2096 Owl Meadow St
- 2106 Owl Meadow St
- 2101 Osprey Ct
- 2105 Osprey Ct
- 2092 Owl Meadow St
- 2097 Osprey Ct
- 356 Barn Owl Ct
- 2107 Owl Meadow St
- 2109 Osprey Ct
- 2114 Owl Meadow St
- 2093 Osprey Ct
- 2088 Owl Meadow St
- 2111 Owl Meadow St
- 350 Barn Owl Ct
- 2118 Owl Meadow St
- 2084 Owl Meadow St
- 2104 Osprey Ct
- 343 Quail Wood Ct
- 2117 Osprey Ct