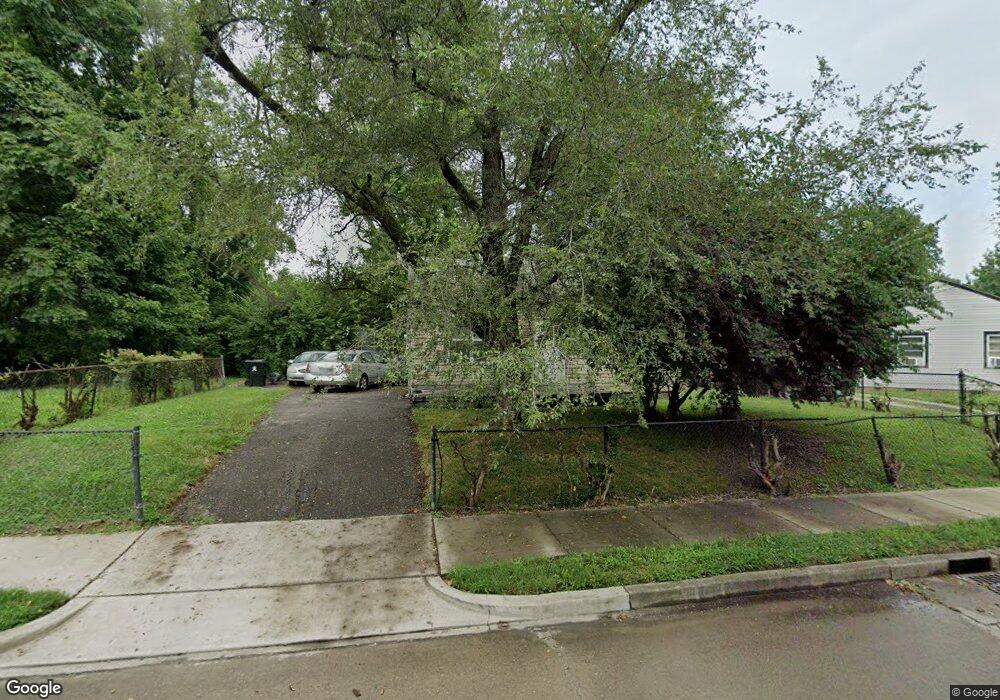
2102 S 40th St Louisville, KY 40211
Park Duvalle NeighborhoodEstimated Value: $72,000 - $90,000
2
Beds
1
Bath
715
Sq Ft
$110/Sq Ft
Est. Value
About This Home
This home is located at 2102 S 40th St, Louisville, KY 40211 and is currently estimated at $78,403, approximately $109 per square foot. 2102 S 40th St is a home located in Jefferson County with nearby schools including Wilkerson Elementary School, Kerrick Elementary School, and Greenwood Elementary School.
Ownership History
Date
Name
Owned For
Owner Type
Purchase Details
Closed on
Aug 6, 2013
Sold by
Small Kathy L
Bought by
Solankhi Naresh and Solankhi Vinod
Current Estimated Value
Purchase Details
Closed on
May 23, 2006
Sold by
Millionaire Mindset Llc
Bought by
Small Kathy L
Home Financials for this Owner
Home Financials are based on the most recent Mortgage that was taken out on this home.
Original Mortgage
$52,000
Interest Rate
6.41%
Mortgage Type
Fannie Mae Freddie Mac
Purchase Details
Closed on
Apr 25, 2006
Sold by
Holbrook Jeffrey P and Holbrook Tammy
Bought by
Millionaire Mindset Llc
Home Financials for this Owner
Home Financials are based on the most recent Mortgage that was taken out on this home.
Original Mortgage
$52,000
Interest Rate
6.41%
Mortgage Type
Fannie Mae Freddie Mac
Purchase Details
Closed on
Mar 11, 2005
Sold by
Standard Federal Bank
Bought by
Holbrook Jeffrey P
Create a Home Valuation Report for This Property
The Home Valuation Report is an in-depth analysis detailing your home's value as well as a comparison with similar homes in the area
Home Values in the Area
Average Home Value in this Area
Purchase History
| Date | Buyer | Sale Price | Title Company |
|---|---|---|---|
| Solankhi Naresh | $17,000 | None Available | |
| Small Kathy L | -- | Kentucky Title Services | |
| Small Kathy L | $42,000 | None Available | |
| Millionaire Mindset Llc | $31,000 | None Available | |
| Holbrook Jeffrey P | $16,000 | None Available |
Source: Public Records
Mortgage History
| Date | Status | Borrower | Loan Amount |
|---|---|---|---|
| Previous Owner | Small Kathy L | $52,000 |
Source: Public Records
Tax History Compared to Growth
Tax History
| Year | Tax Paid | Tax Assessment Tax Assessment Total Assessment is a certain percentage of the fair market value that is determined by local assessors to be the total taxable value of land and additions on the property. | Land | Improvement |
|---|---|---|---|---|
| 2024 | $441 | $34,370 | $3,760 | $30,610 |
| 2023 | $461 | $34,370 | $3,760 | $30,610 |
| 2022 | $261 | $19,160 | $2,500 | $16,660 |
| 2021 | $278 | $19,160 | $2,500 | $16,660 |
| 2020 | $263 | $19,160 | $2,500 | $16,660 |
| 2019 | $257 | $19,160 | $2,500 | $16,660 |
| 2018 | $272 | $20,570 | $2,500 | $18,070 |
| 2017 | $268 | $20,570 | $2,500 | $18,070 |
| 2013 | $350 | $35,000 | $7,000 | $28,000 |
Source: Public Records
Map
Nearby Homes
- 2023 S 41st St
- 3524 Algonquin Pkwy
- 3313 Bells Ln
- 1705 Stratton Ct
- 4202 Fordson Way
- 1932 Beech St
- 3215 Kingswood Way
- 1443 S 32nd St
- 3220 Kingswood Way
- 4208 Winnrose Way
- 1600 Beech St
- 4212 Winnrose Way
- 4133 Winnrose Way
- 3121 W Magnolia Ave
- 4136 Virginia Ave
- 1206 Fairland Place
- 2637 Algonquin Pkwy
- 1215 S 43rd St
- 1205 S 43rd St
- 2811 Narragansett Dr
- 2100 S 40th St
- 2104 S 40th St
- 4010 Algonquin Pkwy
- 4012 Algonquin Pkwy
- 2106 S 40th St
- 2108 S 40th St
- 2101 S 41st St
- 2110 S 40th St
- 2112 S 40th St
- 2030 S 40th St
- 2114 S 40th St
- 4011 Algonquin Pkwy
- 2116 S 40th St
- 4013 Algonquin Pkwy
- 2045 S 41st St
- 2028 S 40th St
- 2118 S 40th St
- 2043 S 41st St
- 2120 S 40th St
- 2122 S 40th St