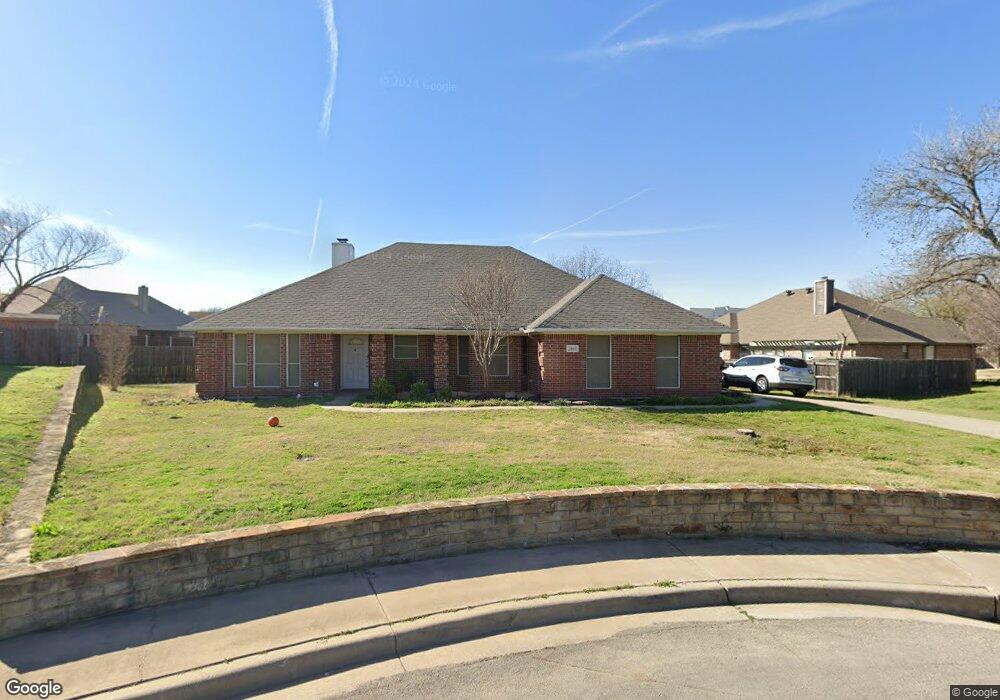
2102 Valley Dr Weatherford, TX 76087
Estimated Value: $330,240 - $374,000
3
Beds
2
Baths
1,805
Sq Ft
$197/Sq Ft
Est. Value
About This Home
This home is located at 2102 Valley Dr, Weatherford, TX 76087 and is currently estimated at $355,310, approximately $196 per square foot. 2102 Valley Dr is a home located in Parker County with nearby schools including Austin Elementary School, Hall Middle School, and Weatherford High School.
Ownership History
Date
Name
Owned For
Owner Type
Purchase Details
Closed on
Nov 3, 2016
Sold by
Tarbert Llc
Bought by
Csh 2016-2 Borrower Llc
Current Estimated Value
Purchase Details
Closed on
Feb 23, 2015
Sold by
Saunders Johnnie P and Jo Lee
Bought by
Csh 2016-2 Borrower Llc
Purchase Details
Closed on
Jun 26, 2012
Sold by
Newsom Ginger G
Bought by
Csh 2016-2 Borrower Llc
Purchase Details
Closed on
Mar 30, 2006
Sold by
Newsom Howell J
Bought by
Csh 2016-2 Borrower Llc
Home Financials for this Owner
Home Financials are based on the most recent Mortgage that was taken out on this home.
Original Mortgage
$130,500
Interest Rate
6.87%
Mortgage Type
Adjustable Rate Mortgage/ARM
Purchase Details
Closed on
Sep 11, 2003
Sold by
Marr Ginger
Bought by
Csh 2016-2 Borrower Llc
Purchase Details
Closed on
Jun 6, 2001
Sold by
S P Residential Properties L P
Bought by
Csh 2016-2 Borrower Llc
Create a Home Valuation Report for This Property
The Home Valuation Report is an in-depth analysis detailing your home's value as well as a comparison with similar homes in the area
Home Values in the Area
Average Home Value in this Area
Purchase History
| Date | Buyer | Sale Price | Title Company |
|---|---|---|---|
| Csh 2016-2 Borrower Llc | -- | -- | |
| Csh 2016-2 Borrower Llc | -- | -- | |
| Tarbert Llc | -- | Fnt | |
| Csh 2016-2 Borrower Llc | -- | -- | |
| Saunders Johnnie P | -- | Fnt | |
| Csh 2016-2 Borrower Llc | -- | -- | |
| Csh 2016-2 Borrower Llc | -- | -- | |
| Csh 2016-2 Borrower Llc | -- | -- |
Source: Public Records
Mortgage History
| Date | Status | Borrower | Loan Amount |
|---|---|---|---|
| Previous Owner | Csh 2016-2 Borrower Llc | $130,500 |
Source: Public Records
Tax History Compared to Growth
Tax History
| Year | Tax Paid | Tax Assessment Tax Assessment Total Assessment is a certain percentage of the fair market value that is determined by local assessors to be the total taxable value of land and additions on the property. | Land | Improvement |
|---|---|---|---|---|
| 2025 | $6,227 | $336,353 | $50,000 | $286,353 |
| 2024 | $6,227 | $323,057 | $40,000 | $283,057 |
| 2023 | $6,227 | $324,430 | $40,000 | $284,430 |
| 2022 | $5,235 | $236,020 | $28,000 | $208,020 |
| 2021 | $5,668 | $236,020 | $28,000 | $208,020 |
| 2020 | $4,962 | $205,350 | $28,000 | $177,350 |
| 2019 | $5,244 | $205,350 | $28,000 | $177,350 |
| 2018 | $4,335 | $169,000 | $28,000 | $141,000 |
| 2017 | $4,447 | $169,000 | $28,000 | $141,000 |
| 2016 | $4,096 | $155,680 | $28,000 | $127,680 |
| 2015 | $3,449 | $155,680 | $28,000 | $127,680 |
| 2014 | $3,360 | $149,650 | $28,000 | $121,650 |
Source: Public Records
Map
Nearby Homes
- 2109 Valley Dr
- 2310 Trace Ridge Dr
- 2117 Trace Ridge Dr
- 2577 Lockwood Ln
- 365 Bonita St
- 2137 Trace Ridge Dr
- 376 Bonita St
- 365 Paloma St
- 368 Lockwood Ln
- 510 Lockwood Ln
- 725 Red Oak Ln
- 1421 Highlake Ln
- 1209 Timber Creek Dr
- 952 Austin Ct
- 938 Austin Ct
- 946 Austin Ct
- 915 Austin Ct
- 1628 Holland Lake Dr
- 118 Black Forest Dr
- 101 Black Forest Dr
- 2114 Sagewood Dr
- 2106 Valley Dr
- 2110 Sagewood Dr
- 2113 Quail Ridge Dr
- 2117 Quail Ridge Dr
- 2118 Sagewood Dr
- 2109 Quail Ridge Dr
- 2106 Sagewood Dr
- 2110 Valley Dr
- 2121 Quail Ridge Dr
- 2105 Quail Ridge Dr
- 2122 Sagewood Dr
- 2113 Sagewood Dr
- 2118 Quail Ridge Dr
- 2109 Sagewood Dr
- 2102 Sagewood Dr
- lot 6N Valley Dr
- 2114 Quail Ridge Dr
- 2114 Valley Dr
- 2125 Quail Ridge Dr