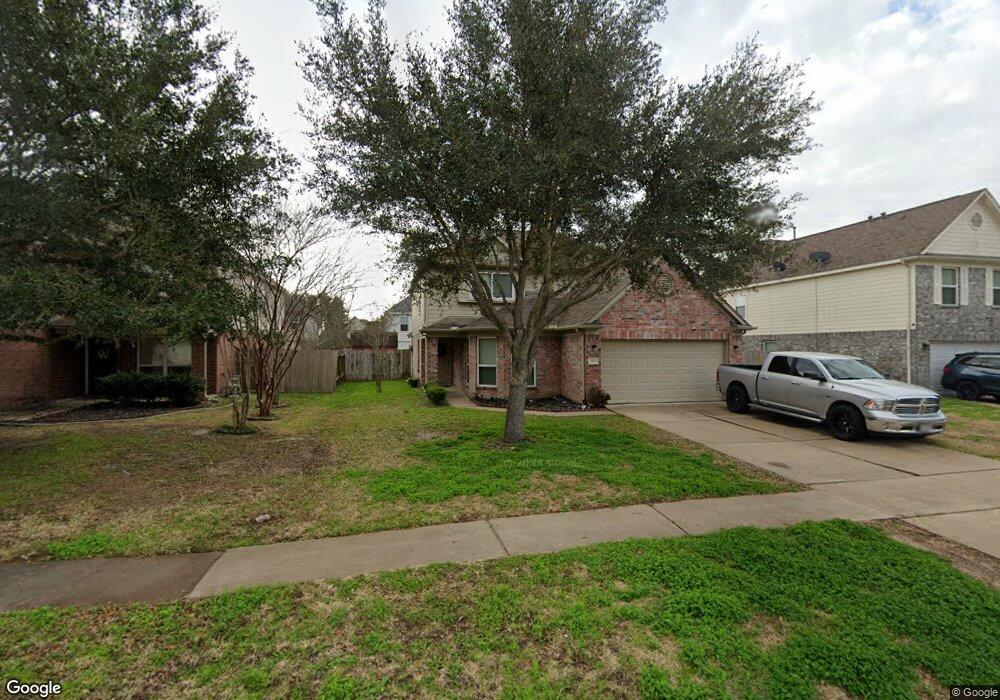
2103 Feather Hill Dr Rosenberg, TX 77471
Estimated Value: $278,610 - $314,000
4
Beds
3
Baths
2,384
Sq Ft
$126/Sq Ft
Est. Value
About This Home
This home is located at 2103 Feather Hill Dr, Rosenberg, TX 77471 and is currently estimated at $300,903, approximately $126 per square foot. 2103 Feather Hill Dr is a home located in Fort Bend County with nearby schools including Thomas R. Culver Elementary School, Navarro Middle School, and George Junior High School.
Ownership History
Date
Name
Owned For
Owner Type
Purchase Details
Closed on
Feb 10, 2020
Sold by
Bhakta Anadi and Basant Robin
Bought by
Ramos Christina Marie and Ramos Adrienne D
Current Estimated Value
Home Financials for this Owner
Home Financials are based on the most recent Mortgage that was taken out on this home.
Original Mortgage
$196,367
Outstanding Balance
$173,935
Interest Rate
3.62%
Mortgage Type
FHA
Estimated Equity
$126,968
Purchase Details
Closed on
Oct 22, 2010
Sold by
Long Lake Ltd
Bought by
Bhakta Anandi
Home Financials for this Owner
Home Financials are based on the most recent Mortgage that was taken out on this home.
Original Mortgage
$116,947
Interest Rate
4.4%
Mortgage Type
FHA
Purchase Details
Closed on
Jul 30, 2010
Sold by
Woodmere Development Co Ltd
Bought by
Bhakta Anandi
Purchase Details
Closed on
Dec 17, 2009
Sold by
Bgm Land Investments Ltd
Bought by
Bhakta Anandi
Create a Home Valuation Report for This Property
The Home Valuation Report is an in-depth analysis detailing your home's value as well as a comparison with similar homes in the area
Home Values in the Area
Average Home Value in this Area
Purchase History
| Date | Buyer | Sale Price | Title Company |
|---|---|---|---|
| Ramos Christina Marie | -- | Capital Title | |
| Bhakta Anandi | -- | American Title Company | |
| Bhakta Anandi | -- | -- | |
| Bhakta Anandi | -- | -- |
Source: Public Records
Mortgage History
| Date | Status | Borrower | Loan Amount |
|---|---|---|---|
| Open | Ramos Christina Marie | $196,367 | |
| Previous Owner | Bhakta Anandi | $116,947 |
Source: Public Records
Tax History Compared to Growth
Tax History
| Year | Tax Paid | Tax Assessment Tax Assessment Total Assessment is a certain percentage of the fair market value that is determined by local assessors to be the total taxable value of land and additions on the property. | Land | Improvement |
|---|---|---|---|---|
| 2025 | $5,765 | $268,249 | $42,900 | $236,333 |
| 2024 | $5,765 | $243,863 | $26,595 | $217,268 |
| 2023 | $5,192 | $221,694 | $0 | $222,440 |
| 2022 | $5,616 | $201,540 | $1,100 | $200,440 |
| 2021 | $5,872 | $183,220 | $33,000 | $150,220 |
| 2020 | $5,887 | $182,140 | $33,000 | $149,140 |
| 2019 | $5,823 | $172,080 | $33,000 | $139,080 |
| 2018 | $5,689 | $165,430 | $33,000 | $132,430 |
| 2017 | $5,690 | $165,200 | $33,000 | $132,200 |
| 2016 | $5,562 | $161,500 | $24,000 | $137,500 |
| 2015 | $2,411 | $146,820 | $24,000 | $122,820 |
| 2014 | $2,175 | $133,470 | $24,000 | $109,470 |
Source: Public Records
Map
Nearby Homes
- 2107 Bishop Hollow Ln
- 2114 Bishop Hollow Ln
- 2031 Upland Plover Ct
- 2110 Juniper Dale Dr
- 2106 Indian Clearing Trail
- 2314 Zephyr Ln
- 1946 Red Cedar Trail
- 3010 Country Clearing Ln
- 3006 Country Clearing Ln
- 2926 Tulip Tree Trail
- 3003 Silverhorn Ln
- 2927 Silverhorn Ln
- 2919 Silverhorn Ln
- 3018 Sage Grouse Ct
- 2918 Silverhorn Ln
- 2535 Zephyr Ln
- 1818 Cardinal Sky Way
- 3202 Dogwood Knoll Trail
- 3003 Sage Grouse Ct
- 2914 Godric Hollow Ln
- 2027 Feather Hill Dr
- 2107 Feather Hill Dr
- 2102 Juniper Dale Dr
- 2023 Feather Hill Dr
- 2111 Feather Hill Dr
- 2106 Juniper Dale Dr
- 2026 Juniper Dale Dr
- 2022 Juniper Dale Dr
- 2019 Feather Hill Dr
- 2106 Feather Hill Dr
- 2102 Feather Hill Dr
- 2115 Feather Hill Dr
- 2022 Feather Hill Dr
- 2110 Feather Hill Dr
- 2114 Juniper Dale Dr
- 2018 Juniper Dale Dr
- 2018 Feather Hill Dr
- 2015 Feather Hill Dr
- 2114 Feather Hill Dr
- 2119 Feather Hill Dr