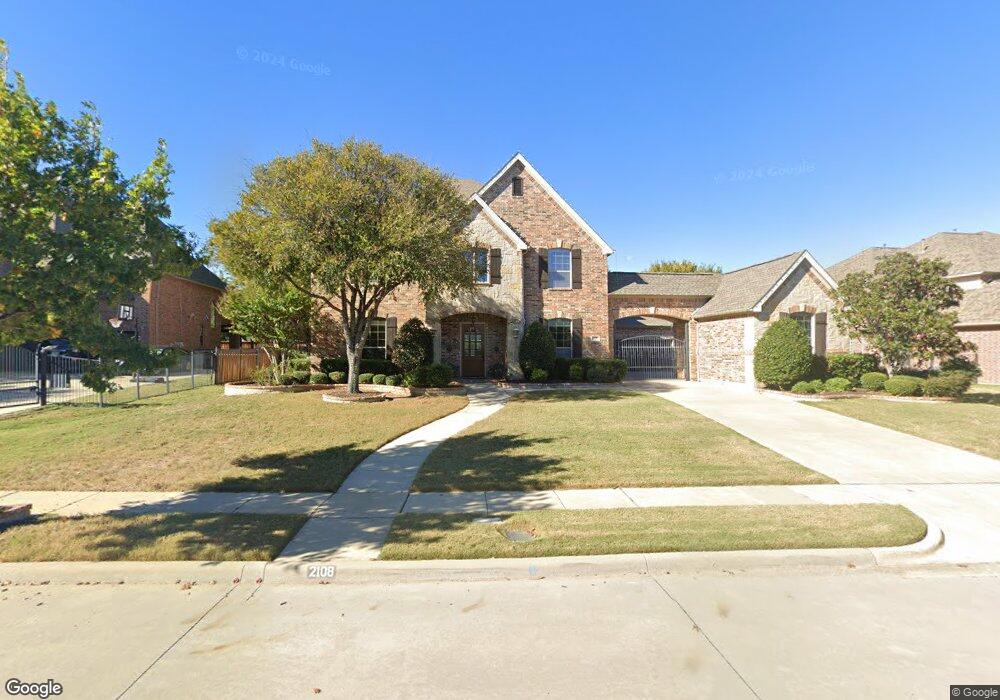
2108 Beaver Creek Ln Southlake, TX 76092
Estimated Value: $1,541,930 - $1,819,000
4
Beds
5
Baths
5,166
Sq Ft
$327/Sq Ft
Est. Value
About This Home
This home is located at 2108 Beaver Creek Ln, Southlake, TX 76092 and is currently estimated at $1,687,983, approximately $326 per square foot. 2108 Beaver Creek Ln is a home located in Tarrant County with nearby schools including Walnut Grove Elementary School, Don T. Durham Intermediate School, and Carroll Middle School.
Ownership History
Date
Name
Owned For
Owner Type
Purchase Details
Closed on
Feb 18, 2020
Sold by
Patel Nirav and Patel Payalben
Bought by
Patel Nirav and Patel Payal
Current Estimated Value
Purchase Details
Closed on
Jul 8, 2014
Sold by
Kofoed Peter and Kofoed Kirstie
Bought by
Patel Nirav and Patel Payalben
Home Financials for this Owner
Home Financials are based on the most recent Mortgage that was taken out on this home.
Original Mortgage
$630,000
Outstanding Balance
$462,982
Interest Rate
3.25%
Mortgage Type
Adjustable Rate Mortgage/ARM
Estimated Equity
$1,225,001
Purchase Details
Closed on
Mar 17, 2008
Sold by
Toll Dallas Tx Llc
Bought by
Kofoed Peter and Kofoed Kirstie
Home Financials for this Owner
Home Financials are based on the most recent Mortgage that was taken out on this home.
Original Mortgage
$631,250
Interest Rate
5.5%
Mortgage Type
Purchase Money Mortgage
Create a Home Valuation Report for This Property
The Home Valuation Report is an in-depth analysis detailing your home's value as well as a comparison with similar homes in the area
Home Values in the Area
Average Home Value in this Area
Purchase History
| Date | Buyer | Sale Price | Title Company |
|---|---|---|---|
| Patel Nirav | -- | None Available | |
| Patel Nirav | -- | Capital Title | |
| Kofoed Peter | -- | Alamo Title Company |
Source: Public Records
Mortgage History
| Date | Status | Borrower | Loan Amount |
|---|---|---|---|
| Open | Patel Nirav | $630,000 | |
| Previous Owner | Kofoed Peter | $631,250 |
Source: Public Records
Tax History Compared to Growth
Tax History
| Year | Tax Paid | Tax Assessment Tax Assessment Total Assessment is a certain percentage of the fair market value that is determined by local assessors to be the total taxable value of land and additions on the property. | Land | Improvement |
|---|---|---|---|---|
| 2025 | $16,407 | $1,166,821 | $277,875 | $888,946 |
| 2024 | $16,407 | $1,502,328 | $277,875 | $1,224,453 |
| 2023 | $17,844 | $1,576,000 | $277,875 | $1,298,125 |
| 2022 | $19,201 | $890,000 | $185,250 | $704,750 |
| 2021 | $20,292 | $890,000 | $185,250 | $704,750 |
| 2020 | $21,193 | $922,000 | $166,725 | $755,275 |
| 2019 | $21,479 | $887,000 | $250,000 | $637,000 |
| 2018 | $19,369 | $845,318 | $250,000 | $595,318 |
| 2017 | $19,048 | $913,175 | $220,000 | $693,175 |
| 2016 | $17,316 | $703,821 | $220,000 | $483,821 |
| 2015 | $15,396 | $635,100 | $100,000 | $535,100 |
| 2014 | $15,396 | $635,100 | $100,000 | $535,100 |
Source: Public Records
Map
Nearby Homes
- 208 Saint Tropez Dr
- 212 Saint Tropez Dr
- 2112 Beaver Creek Ln
- 1821 Cannes Cir
- 100 La Rambla Ct
- 116 La Rambla Ct
- 217 La Rambla Ct
- 209 La Rambla Ct
- 1828 Riviera Ln
- 1829 Cannes Cir
- 124 La Rambla Ct
- 1813 Cannes Cir
- 1820 Riviera Ln
- 221 La Rambla Ct
- 1837 Cannes Cir
- 213 La Rambla Ct
- 105 Murano Place
- 109 Murano Place
- 1812 Riviera Ln
- 225 Murano Place
- 2104 Beaver Creek Ln
- 113 Brentwood Cir
- 304 Boulder Dr
- 2111 Beaver Creek Ln
- 2100 Beaver Creek Ln
- 116 Brentwood Cir
- 301 Boulder Dr
- 2115 Beaver Creek Ln
- 124 Keystone Dr
- 308 Boulder Dr
- 120 Keystone Dr
- 305 Boulder Dr
- 2119 Beaver Creek Ln
- 116 Keystone Dr
- 109 Brentwood Cir
- 309 Boulder Dr
- 2104 Canyon Park Dr
- 2123 Beaver Creek Ln
- 312 Boulder Dr
- 216 Saint Tropez Dr