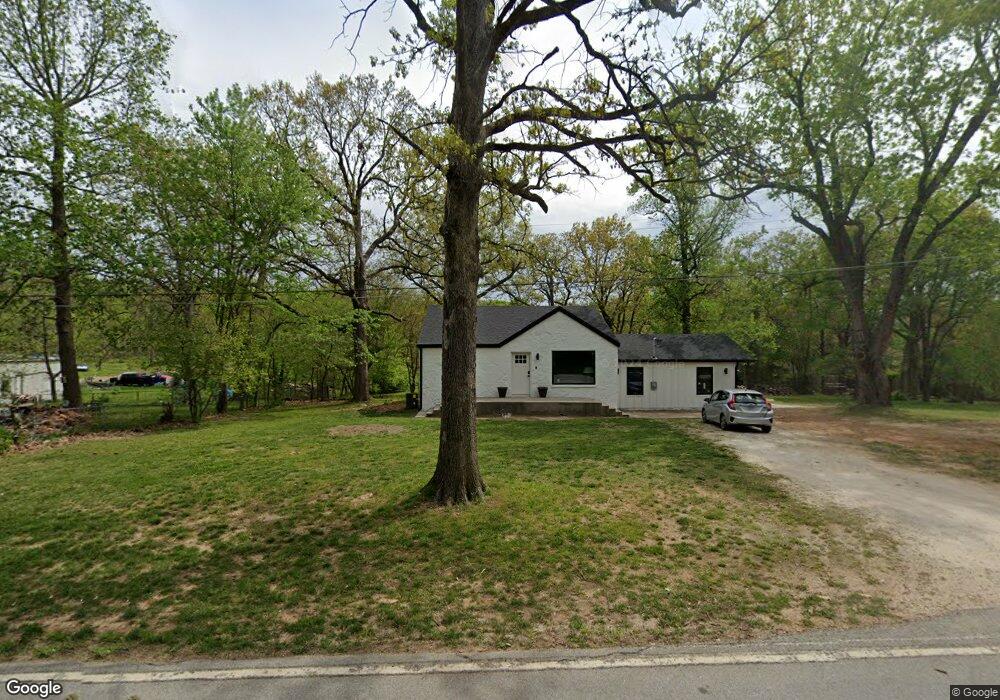
2108 W Farm Road 92 Springfield, MO 65803
Estimated Value: $224,000 - $296,000
2
Beds
2
Baths
1,152
Sq Ft
$227/Sq Ft
Est. Value
About This Home
This home is located at 2108 W Farm Road 92, Springfield, MO 65803 and is currently estimated at $261,709, approximately $227 per square foot. 2108 W Farm Road 92 is a home located in Greene County with nearby schools including Watkins Elementary School, Reed Academy, and Hillcrest High School.
Ownership History
Date
Name
Owned For
Owner Type
Purchase Details
Closed on
Nov 18, 2022
Sold by
Rear Madison S
Bought by
Msm Saddleclub Llc
Current Estimated Value
Purchase Details
Closed on
Apr 25, 2022
Sold by
Rear Madison and Rear Timothy Tyler
Bought by
Presley Paul
Home Financials for this Owner
Home Financials are based on the most recent Mortgage that was taken out on this home.
Original Mortgage
$190,000
Interest Rate
4.38%
Purchase Details
Closed on
Oct 30, 2020
Sold by
Rosenthal Mike and Rosenthal Rose
Bought by
Milligan Madison S
Home Financials for this Owner
Home Financials are based on the most recent Mortgage that was taken out on this home.
Original Mortgage
$91,800
Interest Rate
2.8%
Mortgage Type
Commercial
Purchase Details
Closed on
May 20, 2020
Sold by
Davis Dolores M
Bought by
Rosenthal Michael and Rosenthal Rose
Create a Home Valuation Report for This Property
The Home Valuation Report is an in-depth analysis detailing your home's value as well as a comparison with similar homes in the area
Home Values in the Area
Average Home Value in this Area
Purchase History
| Date | Buyer | Sale Price | Title Company |
|---|---|---|---|
| Msm Saddleclub Llc | -- | -- | |
| Presley Paul | -- | -- | |
| Milligan Madison S | -- | None Available | |
| Rosenthal Michael | -- | None Available |
Source: Public Records
Mortgage History
| Date | Status | Borrower | Loan Amount |
|---|---|---|---|
| Previous Owner | Presley Paul | $190,000 | |
| Previous Owner | Milligan Madison S | $91,800 |
Source: Public Records
Tax History Compared to Growth
Tax History
| Year | Tax Paid | Tax Assessment Tax Assessment Total Assessment is a certain percentage of the fair market value that is determined by local assessors to be the total taxable value of land and additions on the property. | Land | Improvement |
|---|---|---|---|---|
| 2025 | $2,045 | $39,600 | $7,240 | $32,360 |
| 2024 | $2,045 | $35,320 | $5,340 | $29,980 |
| 2023 | $801 | $13,910 | $5,340 | $8,570 |
| 2022 | $802 | $13,640 | $5,340 | $8,300 |
| 2021 | $767 | $13,640 | $5,340 | $8,300 |
| 2020 | $795 | $13,420 | $5,340 | $8,080 |
| 2019 | $772 | $13,420 | $5,340 | $8,080 |
| 2018 | $826 | $14,290 | $5,340 | $8,950 |
| 2017 | $819 | $13,700 | $5,340 | $8,360 |
| 2016 | $784 | $13,700 | $5,340 | $8,360 |
| 2015 | $778 | $13,700 | $5,340 | $8,360 |
| 2014 | $782 | $13,700 | $5,340 | $8,360 |
Source: Public Records
Map
Nearby Homes
- 2586 E Theran Ave Unit (Ph 1, Lot 14)
- Lot 6 N Farm Rd 139
- 000 Highland Acres
- Lot 4 N Farm Rd 139
- 2750 W Bonita St
- 2686 W Brook Ridge St
- 3891 N Spring Branch Ave
- 3671 N Farm Road 147
- 3879 N Williams Ct
- 3877 N Daniels Ct
- 3486 N Farm Road 143
- 1158 W Bradley St
- 1352 W Vancouver St
- 845 W Farm Road 96
- 3714 N Mount Zion Ct
- 3740 N Oak Point Ave
- 3645 N Oak Point Ave
- 1942 W McCanse St
- 3582 N Thistlewood Ct
- 3031 W Augusta Hills St
- 2074 W Farm Road 92
- 2174 W Farm Road 92
- 0 W Farm Road 92
- 0 W Farm Road 92
- 2038 W Farm Road 92
- 2024 W Farm Road 92
- 0000 W Farm Road 94
- 2075 W Farm Road 92
- 2122 W Farm Road 94
- 2160 W Farm Road 94
- 4202 N Farm Road 143
- 4255 N Farm Road 143
- 2007 W Farm Road 94
- 2231 W Farm Road 94
- 4237 N Farm Road 143
- 4219 N Farm Road 143
- 4178 N Farm Road 143
- 2016 W Farm Road 94
- 4201 N Farm Road 143
- 4175 N Farm Road 143