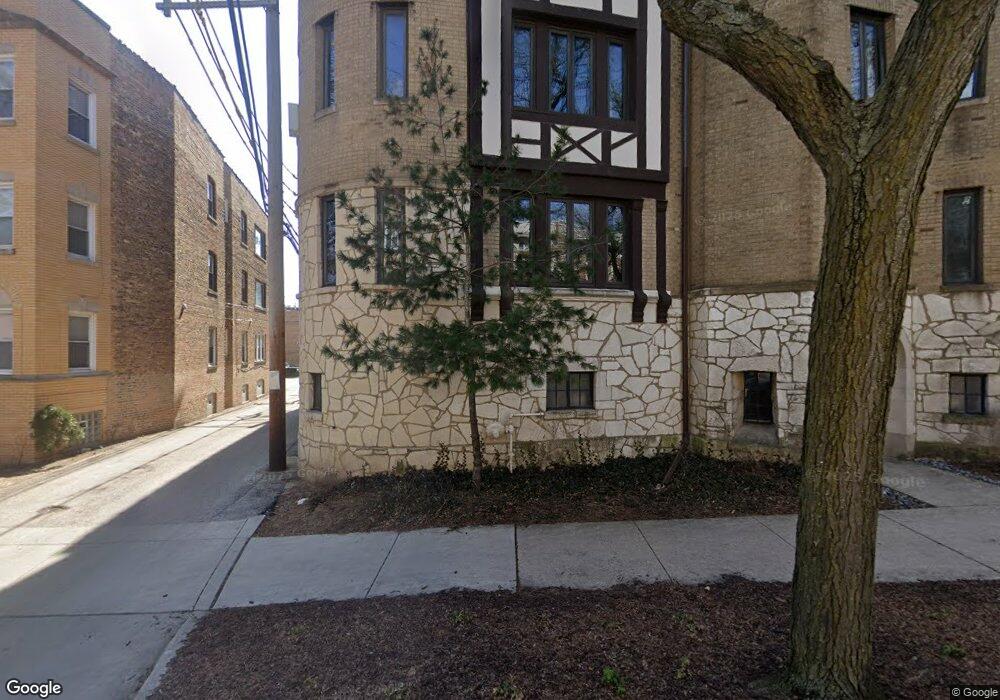
2109 W Jarvis Ave Unit 21092 Chicago, IL 60645
Rogers Park NeighborhoodEstimated Value: $332,000 - $395,000
3
Beds
2
Baths
1,900
Sq Ft
$188/Sq Ft
Est. Value
About This Home
This home is located at 2109 W Jarvis Ave Unit 21092, Chicago, IL 60645 and is currently estimated at $356,384, approximately $187 per square foot. 2109 W Jarvis Ave Unit 21092 is a home located in Cook County with nearby schools including George Armstrong Elementary School, Sullivan High School, and Acero - Sor Juana Ines de la Cruz School.
Ownership History
Date
Name
Owned For
Owner Type
Purchase Details
Closed on
Oct 18, 2013
Sold by
Johnson Virgil
Bought by
Vinkler Gregory
Current Estimated Value
Home Financials for this Owner
Home Financials are based on the most recent Mortgage that was taken out on this home.
Original Mortgage
$208,000
Outstanding Balance
$156,841
Interest Rate
4.59%
Mortgage Type
New Conventional
Estimated Equity
$199,543
Purchase Details
Closed on
Aug 19, 2006
Sold by
Johnson Virgil
Bought by
Johnson Virgil and Virgil Johnson Trust
Purchase Details
Closed on
Aug 30, 1997
Sold by
Macdonald Heather Ridge and Ridge Heather
Bought by
Johnson Virgil C
Home Financials for this Owner
Home Financials are based on the most recent Mortgage that was taken out on this home.
Original Mortgage
$116,100
Interest Rate
7.12%
Create a Home Valuation Report for This Property
The Home Valuation Report is an in-depth analysis detailing your home's value as well as a comparison with similar homes in the area
Home Values in the Area
Average Home Value in this Area
Purchase History
| Date | Buyer | Sale Price | Title Company |
|---|---|---|---|
| Vinkler Gregory | $260,000 | Git | |
| Johnson Virgil | -- | None Available | |
| Johnson Virgil C | $86,000 | Republic Title Company |
Source: Public Records
Mortgage History
| Date | Status | Borrower | Loan Amount |
|---|---|---|---|
| Open | Vinkler Gregory | $208,000 | |
| Previous Owner | Johnson Virgil C | $116,100 |
Source: Public Records
Tax History Compared to Growth
Tax History
| Year | Tax Paid | Tax Assessment Tax Assessment Total Assessment is a certain percentage of the fair market value that is determined by local assessors to be the total taxable value of land and additions on the property. | Land | Improvement |
|---|---|---|---|---|
| 2024 | $2,328 | $27,347 | $2,481 | $24,866 |
| 2023 | $2,230 | $17,000 | $1,984 | $15,016 |
| 2022 | $2,230 | $17,000 | $1,984 | $15,016 |
| 2021 | $1,970 | $15,790 | $1,984 | $13,806 |
| 2020 | $1,758 | $13,475 | $1,598 | $11,877 |
| 2019 | $1,778 | $15,021 | $1,598 | $13,423 |
| 2018 | $1,746 | $15,021 | $1,598 | $13,423 |
| 2017 | $4,056 | $18,843 | $1,433 | $17,410 |
| 2016 | $2,917 | $18,843 | $1,433 | $17,410 |
| 2015 | $3,814 | $23,439 | $1,433 | $22,006 |
| 2014 | $1,400 | $10,112 | $1,322 | $8,790 |
| 2013 | $1,839 | $10,112 | $1,322 | $8,790 |
Source: Public Records
Map
Nearby Homes
- 2109 W Jarvis Ave Unit 1
- 2044 W Jarvis Ave Unit 3G
- 2038 W Jarvis Ave Unit 20382D
- 2038 W Jarvis Ave Unit 2F
- 7344 N Ridge Blvd Unit 5C
- 7348 N Ridge Blvd Unit 16B
- 7228 N Rogers Ave
- 7323 N Damen Ave
- 7234 N Hamilton Ave
- 7227 N Damen Ave
- 7223 N Damen Ave
- 7320 N Rogers Ave Unit 514
- 7315 N Oakley Ave Unit 1A
- 7207 N Damen Ave Unit 2
- 7433 N Damen Ave
- 2175 W Touhy Ave
- 7223 N Oakley Ave Unit 1E
- 2224 W Touhy Ave Unit 3N
- 7102 N Damen Ave Unit 3
- 7074 N Ridge Blvd Unit 1E
- 2109 W Jarvis Ave Unit 2
- 2109 W Jarvis Ave Unit 21091
- 2109 W Jarvis Ave Unit 21093
- 2109 W Jarvis Ave Unit 3W
- 2107 W Jarvis Ave Unit 21073
- 2107 W Jarvis Ave Unit 21072
- 2107 W Jarvis Ave Unit 21071
- 2067 W Jarvis Ave
- 2067 W Jarvis Ave
- 2065 W Jarvis Ave Unit 1E
- 2065 W Jarvis Ave Unit 2W
- 2065 W Jarvis Ave Unit 3W
- 2065 W Jarvis Ave
- 2065 W Jarvis Ave Unit 3E
- 2065 W Jarvis Ave Unit 2E
- 2063 W Jarvis Ave
- 2063 W Jarvis Ave
- 7319 N Rogers Ave
- 7319 N Rogers Ave Unit ON
- 7319 N Rogers Ave Unit 202