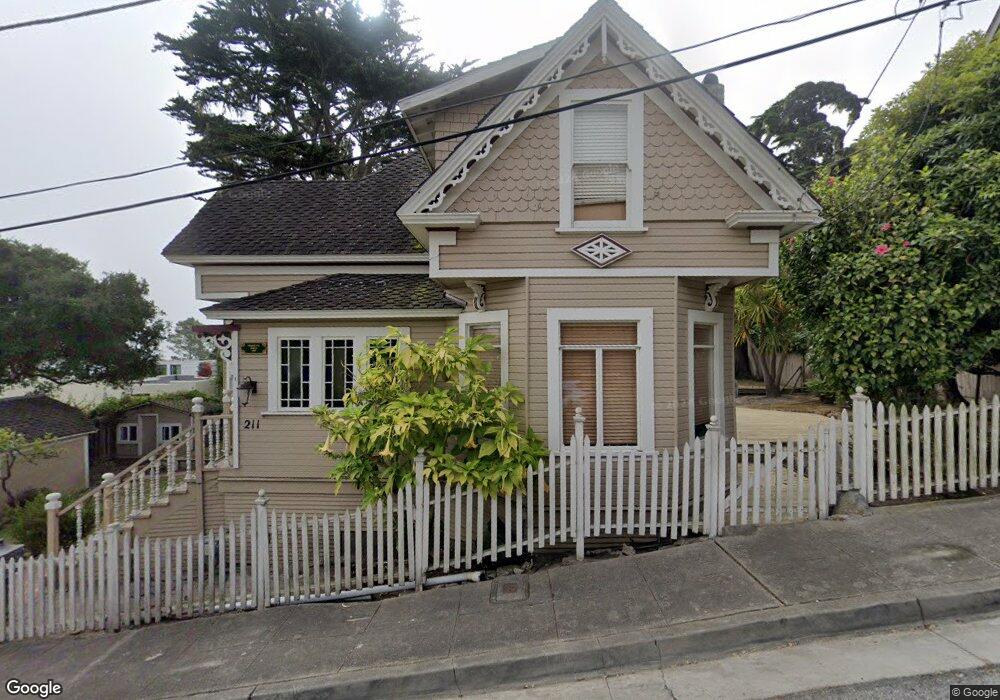
211 4th St Pacific Grove, CA 93950
Estimated Value: $1,306,000 - $1,933,000
3
Beds
2
Baths
1,707
Sq Ft
$940/Sq Ft
Est. Value
About This Home
This home is located at 211 4th St, Pacific Grove, CA 93950 and is currently estimated at $1,603,961, approximately $939 per square foot. 211 4th St is a home located in Monterey County with nearby schools including Robert Down Elementary School, Pacific Grove Middle School, and Pacific Grove High School.
Ownership History
Date
Name
Owned For
Owner Type
Purchase Details
Closed on
Dec 21, 2005
Sold by
Bazan Carlos
Bought by
Bazan Carlos and Trust Of Carlos Bazan
Current Estimated Value
Purchase Details
Closed on
Sep 15, 2003
Sold by
Mcgreevy Martin J and Mcgreevy Michelle B
Bought by
Bazan Carlos and Trust Of Carlos Bazan
Purchase Details
Closed on
May 7, 2000
Sold by
Mcgreevy Martin J and Mcgreevey Michelle R
Bought by
Bazan Carlos and Mcgreevey Martin J
Home Financials for this Owner
Home Financials are based on the most recent Mortgage that was taken out on this home.
Original Mortgage
$540,000
Interest Rate
6.87%
Purchase Details
Closed on
Apr 11, 2000
Sold by
Frederickson Jean W
Bought by
Mcgreevey Martin J and Mcgreevy Michelle B
Home Financials for this Owner
Home Financials are based on the most recent Mortgage that was taken out on this home.
Original Mortgage
$540,000
Interest Rate
6.87%
Create a Home Valuation Report for This Property
The Home Valuation Report is an in-depth analysis detailing your home's value as well as a comparison with similar homes in the area
Home Values in the Area
Average Home Value in this Area
Purchase History
| Date | Buyer | Sale Price | Title Company |
|---|---|---|---|
| Bazan Carlos | -- | First American Title | |
| Bazan Carlos | -- | First American Title | |
| Bazan Carlos | -- | -- | |
| Mcgreevey Martin J | $675,000 | Old Republic Title Company |
Source: Public Records
Mortgage History
| Date | Status | Borrower | Loan Amount |
|---|---|---|---|
| Previous Owner | Mcgreevey Martin J | $540,000 |
Source: Public Records
Tax History Compared to Growth
Tax History
| Year | Tax Paid | Tax Assessment Tax Assessment Total Assessment is a certain percentage of the fair market value that is determined by local assessors to be the total taxable value of land and additions on the property. | Land | Improvement |
|---|---|---|---|---|
| 2025 | $11,748 | $1,037,443 | $768,484 | $268,959 |
| 2024 | $11,748 | $1,017,102 | $753,416 | $263,686 |
| 2023 | $11,000 | $997,160 | $738,644 | $258,516 |
| 2022 | $10,777 | $977,609 | $724,161 | $253,448 |
| 2021 | $10,722 | $958,441 | $709,962 | $248,479 |
| 2020 | $10,507 | $948,615 | $702,683 | $245,932 |
| 2019 | $10,173 | $930,015 | $688,905 | $241,110 |
| 2018 | $9,970 | $911,781 | $675,398 | $236,383 |
| 2017 | $9,808 | $893,904 | $662,155 | $231,749 |
| 2016 | $9,832 | $876,377 | $649,172 | $227,205 |
| 2015 | $9,673 | $863,214 | $639,421 | $223,793 |
| 2014 | $9,471 | $846,306 | $626,896 | $219,410 |
Source: Public Records
Map
Nearby Homes
- 311 Lighthouse Ave
- 229 7th St
- 131 7th St
- 306 9th St
- 116 Evans Ave
- 406 10th St
- 405 Carmel Ave
- 155 12th St
- 723 Eardley Ave
- 515 13th St
- 520 Lighthouse Ave Unit 301
- 414 Sinex Ave
- 542 Lighthouse Ave Unit 301
- 119 Fountain Ave
- 767 Lily St
- 585 Laine St Unit 10
- 224 16th St
- 132 Forest Ave
- 127 16th St
- 799 Grace St