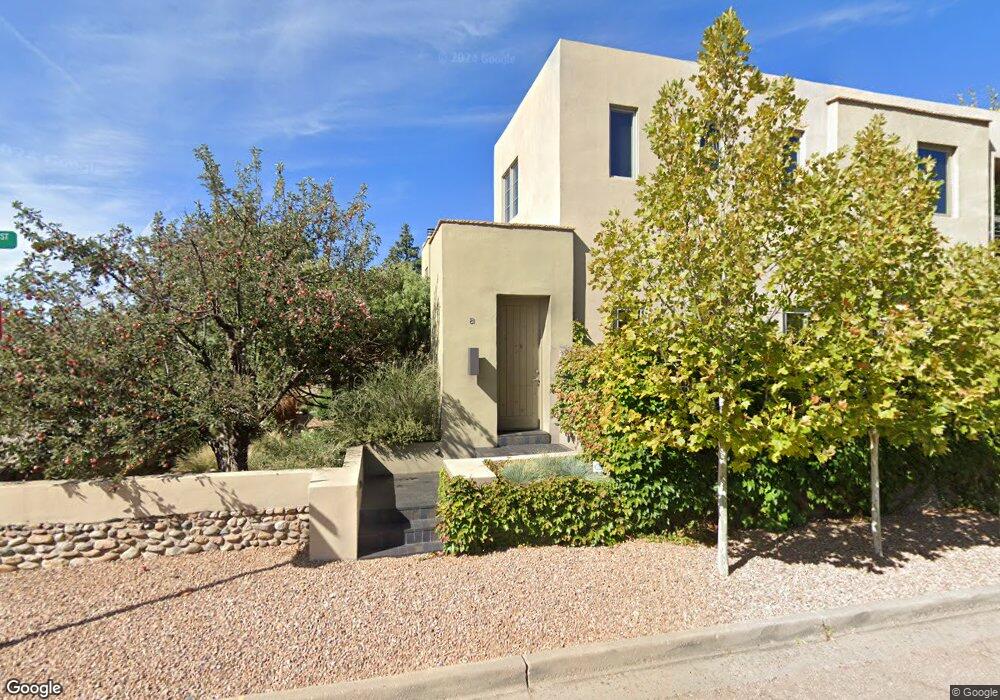
211 Callecita Place Unit D Santa Fe, NM 87501
North Hills NeighborhoodEstimated Value: $674,000 - $812,723
2
Beds
3
Baths
1,281
Sq Ft
$587/Sq Ft
Est. Value
About This Home
This home is located at 211 Callecita Place Unit D, Santa Fe, NM 87501 and is currently estimated at $752,181, approximately $587 per square foot. 211 Callecita Place Unit D is a home located in Santa Fe County with nearby schools including Carlos Gilbert Elementary School, Santa Fe High School, and New Mexico School for the Arts.
Ownership History
Date
Name
Owned For
Owner Type
Purchase Details
Closed on
May 17, 2021
Sold by
Podmore Richard S and Podmore Richard S
Bought by
Schaefer Gary Alan and Schaefer Carol Deal
Current Estimated Value
Home Financials for this Owner
Home Financials are based on the most recent Mortgage that was taken out on this home.
Original Mortgage
$532,500
Outstanding Balance
$482,578
Interest Rate
3.1%
Mortgage Type
New Conventional
Estimated Equity
$269,603
Purchase Details
Closed on
Oct 7, 2011
Sold by
Holbrook Jeffrey R
Bought by
Podmore Richard S and Podmore Judith A
Purchase Details
Closed on
Jul 24, 2006
Sold by
Callecita Partners Llc
Bought by
Holbrook Jeffrey R
Home Financials for this Owner
Home Financials are based on the most recent Mortgage that was taken out on this home.
Original Mortgage
$120,000
Interest Rate
6.62%
Mortgage Type
Purchase Money Mortgage
Create a Home Valuation Report for This Property
The Home Valuation Report is an in-depth analysis detailing your home's value as well as a comparison with similar homes in the area
Home Values in the Area
Average Home Value in this Area
Purchase History
| Date | Buyer | Sale Price | Title Company |
|---|---|---|---|
| Schaefer Gary Alan | -- | Sftc | |
| Podmore Richard S | -- | Multiple | |
| Holbrook Jeffrey R | -- | Quiet Title Co Llc |
Source: Public Records
Mortgage History
| Date | Status | Borrower | Loan Amount |
|---|---|---|---|
| Open | Schaefer Gary Alan | $532,500 | |
| Previous Owner | Holbrook Jeffrey R | $120,000 |
Source: Public Records
Tax History Compared to Growth
Tax History
| Year | Tax Paid | Tax Assessment Tax Assessment Total Assessment is a certain percentage of the fair market value that is determined by local assessors to be the total taxable value of land and additions on the property. | Land | Improvement |
|---|---|---|---|---|
| 2024 | $4,732 | $620,914 | -- | $620,914 |
| 2023 | $4,874 | $620,914 | $0 | $620,914 |
| 2022 | $4,909 | $620,914 | $0 | $620,914 |
| 2021 | $2,744 | $116,070 | $0 | $116,070 |
| 2020 | $2,660 | $112,689 | $0 | $112,689 |
| 2019 | $2,621 | $109,407 | $0 | $109,407 |
| 2018 | $2,562 | $106,221 | $0 | $106,221 |
| 2017 | $2,496 | $103,127 | $0 | $103,127 |
| 2016 | $2,352 | $100,124 | $0 | $100,124 |
| 2015 | $2,296 | $97,208 | $0 | $97,208 |
| 2014 | $2,158 | $94,282 | $0 | $94,282 |
Source: Public Records
Map
Nearby Homes
- 321 Callecita Place
- 101 Callecita Place Unit 1,2,3
- 663 Bishops Lodge Rd Unit 24
- 224 Artist Rd Unit 1
- 227 Artist Rd
- 102 Camino Santiago
- 104 Camino Matias Unit Lot 29
- 112 A&B Camino Mattias
- 320 Artist Rd Unit 14
- 320 Artist Rd Unit 12
- 320 Artist Rd Unit 95
- 320 Artist Rd Unit 89
- 320 Artist Rd Unit 52
- 320 Artist Rd Unit 8
- 320 Artist Rd Unit 58
- 335 Otero St
- 111 Camino Matias
- 107 A&B Camino Santiago Unit Lot 4
- 105 A&B Camino Santiago Unit Lot 3
- 110 A&B Camino Santiago
- 211 Callecita Place
- 211 Callecita Place
- 211 Callecita Place
- 211 Callecita Place
- 211 Callecita Place Unit E
- 211 Callecita Place Unit C
- 211 Callecita Place Unit A
- 211 Callecita Place Unit B
- 602 Sunset St
- 209 Callecita Place
- 601 Sunset St
- # 47 Ca Casabella
- 604 Sunset Street C
- 515 Sunset St
- 510 Sunset St
- 210 Callecita Place
- 604 Sunset St
- 604 Sunset St
- 604 Sunset St
- 604 Sunset St