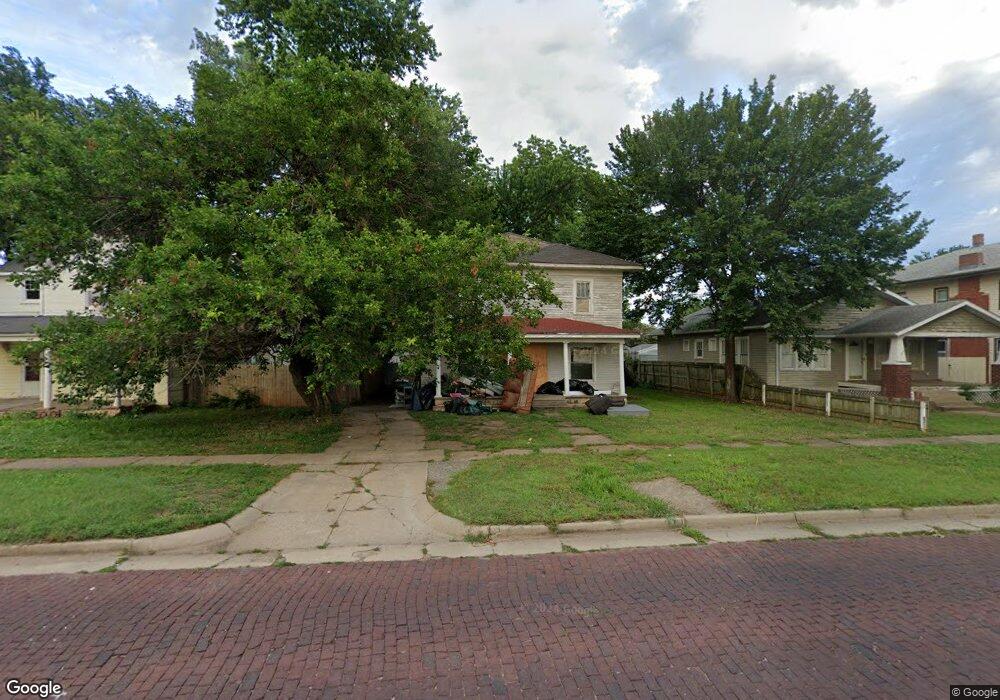
211 S 7th St Ponca City, OK 74601
Estimated Value: $106,000 - $442,952
4
Beds
4
Baths
2,190
Sq Ft
$92/Sq Ft
Est. Value
About This Home
This home is located at 211 S 7th St, Ponca City, OK 74601 and is currently estimated at $201,488, approximately $92 per square foot. 211 S 7th St is a home located in Kay County with nearby schools including Garfield Elementary School, Ponca City East Middle School, and Ponca City West Middle School.
Ownership History
Date
Name
Owned For
Owner Type
Purchase Details
Closed on
Jun 6, 2022
Sold by
Wilson Alan B
Bought by
Cain Jason and Cain Amanda
Current Estimated Value
Purchase Details
Closed on
Jul 6, 2020
Sold by
Wilson Sarah E
Bought by
Wilson Adam B
Purchase Details
Closed on
Jul 18, 2018
Sold by
Purvis Joseph P and Purvis Elsbeth C
Bought by
Wilson Adam B and Wilson Sarah E
Home Financials for this Owner
Home Financials are based on the most recent Mortgage that was taken out on this home.
Original Mortgage
$130,000
Interest Rate
4.5%
Mortgage Type
Purchase Money Mortgage
Purchase Details
Closed on
Jun 20, 2007
Sold by
Barkley Tommie L and Barkley Martha
Bought by
Adams Thomas Spencer
Purchase Details
Closed on
Sep 11, 1997
Sold by
Deborah A Livingston
Bought by
Martha Tommie and Martha Barkley
Purchase Details
Closed on
Mar 16, 1988
Sold by
Mc David and Mc Lendon E
Bought by
Deborah A Livingston
Create a Home Valuation Report for This Property
The Home Valuation Report is an in-depth analysis detailing your home's value as well as a comparison with similar homes in the area
Home Values in the Area
Average Home Value in this Area
Purchase History
| Date | Buyer | Sale Price | Title Company |
|---|---|---|---|
| Cain Jason | -- | None Listed On Document | |
| Wilson Adam B | -- | None Available | |
| Wilson Adam B | $135,000 | None Available | |
| Adams Thomas Spencer | $20,250 | -- | |
| Martha Tommie | $41,500 | -- | |
| Deborah A Livingston | $37,000 | -- |
Source: Public Records
Mortgage History
| Date | Status | Borrower | Loan Amount |
|---|---|---|---|
| Previous Owner | Wilson Adam B | $130,000 |
Source: Public Records
Tax History Compared to Growth
Tax History
| Year | Tax Paid | Tax Assessment Tax Assessment Total Assessment is a certain percentage of the fair market value that is determined by local assessors to be the total taxable value of land and additions on the property. | Land | Improvement |
|---|---|---|---|---|
| 2024 | $686 | $7,249 | $499 | $6,750 |
| 2023 | $686 | $6,999 | $499 | $6,500 |
| 2022 | $388 | $4,074 | $499 | $3,575 |
| 2021 | $390 | $4,074 | $499 | $3,575 |
| 2020 | $378 | $3,989 | $499 | $3,490 |
| 2019 | $363 | $3,798 | $499 | $3,299 |
| 2018 | $377 | $3,891 | $499 | $3,392 |
| 2017 | $381 | $3,891 | $499 | $3,392 |
| 2016 | $427 | $4,316 | $554 | $3,762 |
| 2015 | $409 | $4,111 | $554 | $3,557 |
| 2014 | $382 | $3,915 | $554 | $3,361 |
Source: Public Records
Map
Nearby Homes
- 310 S 9th St
- 202 N 7th St
- 408 S 4th St
- 310 N 7th St Unit 660
- 213 N 10th St
- 701 S 8th St
- 212 E Ponca Ave
- 409 N 5th St
- 417 S 2nd St
- 216 N 12th St Unit 840
- 417 N 3rd St
- 800 S 12th St
- 4025 S Union St
- 1001 S 9th St
- 1020 S 8th St
- 815 E Madison Ave
- 410 Drake Dr
- 1103 S 6th St
- 525 Monument Rd
- 214 Virginia Ave