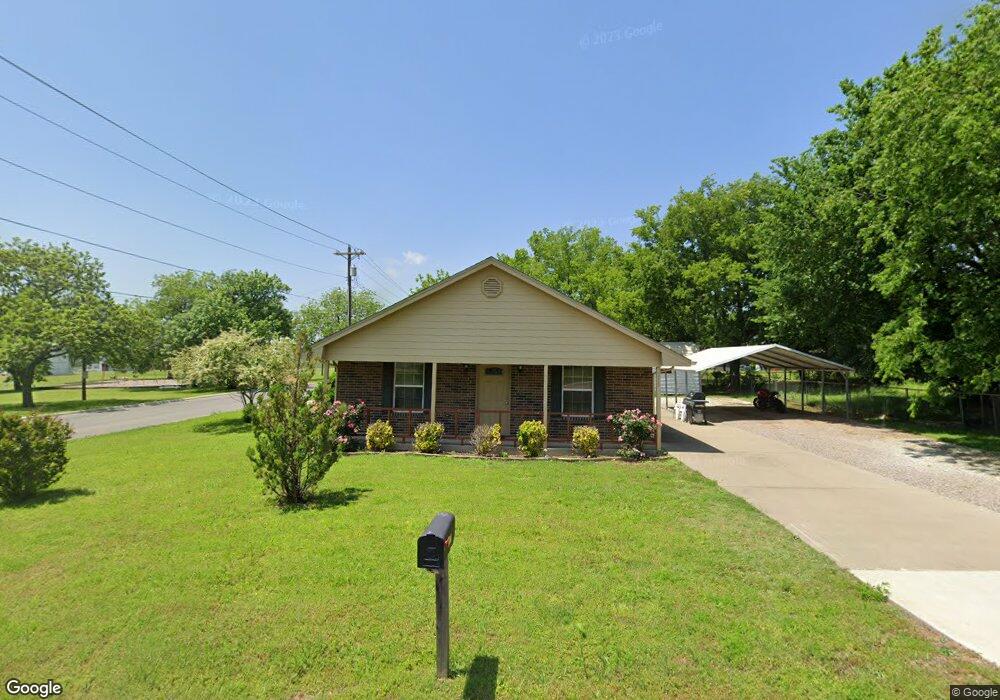
211 S Jordan St Whitesboro, TX 76273
Estimated Value: $194,894 - $200,000
1
Bed
2
Baths
1,047
Sq Ft
$189/Sq Ft
Est. Value
About This Home
This home is located at 211 S Jordan St, Whitesboro, TX 76273 and is currently estimated at $197,447, approximately $188 per square foot. 211 S Jordan St is a home located in Grayson County with nearby schools including J.W. Hayes Primary School, Whitesboro Intermediate School, and Whitesboro Middle School.
Ownership History
Date
Name
Owned For
Owner Type
Purchase Details
Closed on
Dec 12, 2019
Sold by
Hampton Jimmy L and Hampton Glenda C
Bought by
Brownlee Ala Irene
Current Estimated Value
Home Financials for this Owner
Home Financials are based on the most recent Mortgage that was taken out on this home.
Original Mortgage
$95,200
Outstanding Balance
$84,096
Interest Rate
3.7%
Mortgage Type
Future Advance Clause Open End Mortgage
Estimated Equity
$113,351
Purchase Details
Closed on
May 17, 2005
Sold by
Henson Melva E
Bought by
Hampton Jimmy L and Hampton Glenda C
Create a Home Valuation Report for This Property
The Home Valuation Report is an in-depth analysis detailing your home's value as well as a comparison with similar homes in the area
Home Values in the Area
Average Home Value in this Area
Purchase History
| Date | Buyer | Sale Price | Title Company |
|---|---|---|---|
| Brownlee Ala Irene | -- | None Available | |
| Hampton Jimmy L | -- | -- |
Source: Public Records
Mortgage History
| Date | Status | Borrower | Loan Amount |
|---|---|---|---|
| Open | Brownlee Ala Irene | $95,200 |
Source: Public Records
Tax History Compared to Growth
Tax History
| Year | Tax Paid | Tax Assessment Tax Assessment Total Assessment is a certain percentage of the fair market value that is determined by local assessors to be the total taxable value of land and additions on the property. | Land | Improvement |
|---|---|---|---|---|
| 2025 | $3,626 | $187,324 | $41,825 | $145,499 |
| 2024 | $3,626 | $184,059 | $47,015 | $137,044 |
| 2023 | $3,002 | $166,514 | $46,349 | $120,165 |
| 2022 | $3,046 | $154,560 | $49,391 | $105,169 |
| 2021 | $2,516 | $117,350 | $34,467 | $82,883 |
| 2020 | $2,777 | $124,362 | $30,000 | $94,362 |
| 2019 | $1,944 | $118,951 | $19,454 | $99,497 |
| 2018 | $1,801 | $101,606 | $19,454 | $82,152 |
| 2017 | $1,656 | $92,395 | $16,187 | $76,208 |
| 2016 | $1,506 | $89,152 | $12,128 | $77,024 |
| 2015 | $373 | $56,564 | $12,128 | $44,436 |
| 2014 | $511 | $56,259 | $12,128 | $44,131 |
Source: Public Records
Map
Nearby Homes