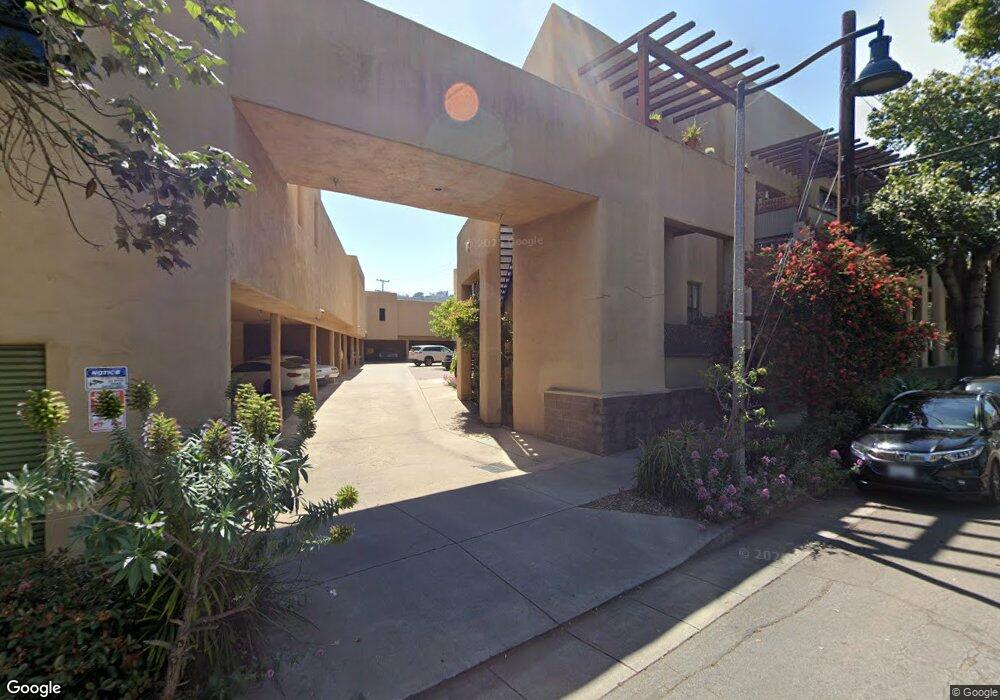
211 W Gutierrez St Unit 15 Santa Barbara, CA 93101
Estimated Value: $713,000 - $928,000
1
Bed
1
Bath
1,120
Sq Ft
$726/Sq Ft
Est. Value
About This Home
This home is located at 211 W Gutierrez St Unit 15, Santa Barbara, CA 93101 and is currently estimated at $813,398, approximately $726 per square foot. 211 W Gutierrez St Unit 15 is a home located in Santa Barbara County with nearby schools including La Cumbre Junior High School, San Marcos Senior High School, and Providence School.
Ownership History
Date
Name
Owned For
Owner Type
Purchase Details
Closed on
Apr 20, 2010
Sold by
Skyles Jeffrey W
Bought by
Royce Shelagh
Current Estimated Value
Home Financials for this Owner
Home Financials are based on the most recent Mortgage that was taken out on this home.
Original Mortgage
$236,400
Interest Rate
5.03%
Mortgage Type
New Conventional
Purchase Details
Closed on
Aug 16, 2005
Sold by
Voss Henry Martens
Bought by
Kelly Peggy
Purchase Details
Closed on
Aug 9, 2005
Sold by
Kelly Peggy
Bought by
Skyles Jeffrey W
Purchase Details
Closed on
Jun 27, 1994
Sold by
Homes For People Inc
Bought by
Voss Henry Martens and Voss Peggy Kelly
Home Financials for this Owner
Home Financials are based on the most recent Mortgage that was taken out on this home.
Original Mortgage
$114,000
Interest Rate
7.25%
Mortgage Type
Purchase Money Mortgage
Create a Home Valuation Report for This Property
The Home Valuation Report is an in-depth analysis detailing your home's value as well as a comparison with similar homes in the area
Home Values in the Area
Average Home Value in this Area
Purchase History
| Date | Buyer | Sale Price | Title Company |
|---|---|---|---|
| Royce Shelagh | $296,500 | Fidelity National Title Co | |
| Kelly Peggy | -- | Fidelity National Title Co | |
| Skyles Jeffrey W | $269,500 | Fidelity National Title Co | |
| Voss Henry Martens | $201,000 | First American Title |
Source: Public Records
Mortgage History
| Date | Status | Borrower | Loan Amount |
|---|---|---|---|
| Previous Owner | Royce Shelagh | $236,400 | |
| Previous Owner | Voss Henry Martens | $114,000 | |
| Closed | Voss Henry Martens | $52,250 | |
| Closed | Skyles Jeffrey W | $0 |
Source: Public Records
Tax History Compared to Growth
Tax History
| Year | Tax Paid | Tax Assessment Tax Assessment Total Assessment is a certain percentage of the fair market value that is determined by local assessors to be the total taxable value of land and additions on the property. | Land | Improvement |
|---|---|---|---|---|
| 2025 | $3,936 | $382,586 | $193,616 | $188,970 |
| 2023 | $3,936 | $367,732 | $186,099 | $181,633 |
| 2022 | $3,794 | $360,522 | $182,450 | $178,072 |
| 2021 | $3,704 | $353,454 | $178,873 | $174,581 |
| 2020 | $3,665 | $349,830 | $177,039 | $172,791 |
| 2019 | $3,599 | $342,971 | $173,568 | $169,403 |
| 2018 | $3,547 | $336,247 | $170,165 | $166,082 |
| 2017 | $3,428 | $329,655 | $166,829 | $162,826 |
| 2016 | $3,419 | $323,192 | $163,558 | $159,634 |
| 2015 | $3,381 | $318,339 | $161,102 | $157,237 |
| 2014 | $3,326 | $312,104 | $157,947 | $154,157 |
Source: Public Records
Map
Nearby Homes
- 401 Chapala St Unit 214
- 401 Chapala St Unit 111
- 517 Brinkerhoff Ave
- 519 Brinkerhoff Ave
- 124 W Yanonali St
- 415 W Gutierrez St Unit 11
- 134 Chapala
- 111 Chapala St
- 324 W Cabrillo Blvd
- 712 Castillo St
- 105 W De la Guerra St Unit S
- 521 W Montecito St Unit 4
- 618 Anacapa St Unit 5
- 325 Ladera St Unit 5
- 218 Santa Barbara St Unit D
- 220 Santa Barbara St Unit C
- 0 Santa Barbara Harbor Unit Marina 3c, Slip St-1
- 330 W Canon Perdido St
- 0 Santa Barbara Harbor Marina 3c Slip St-13 Unit 25566593
- 611 Miramonte Dr
- 211 W Gutierrez St Unit 8
- 211 W Gutierrez St Unit 7
- 211 W Gutierrez St Unit 6
- 211 W Gutierrez St Unit 5
- 211 W Gutierrez St Unit 4
- 211 W Gutierrez St Unit 3
- 211 W Gutierrez St Unit 2
- 211 W Gutierrez St Unit 1
- 211 W Gutierrez St Unit 17
- 211 W Gutierrez St Unit 16
- 211 W Gutierrez St Unit 14
- 211 W Gutierrez St Unit 13
- 211 W Gutierrez St Unit 12
- 211 W Gutierrez St Unit 11
- 211 W Gutierrez St Unit 10
- 211 W Gutierrez St Unit 9
- 211 W Gutierrez #2 Unit 2
- 211 W Gutierrez #7 Unit 7
- 213 W Gutierrez St
- 209 Cottage Grove Ave