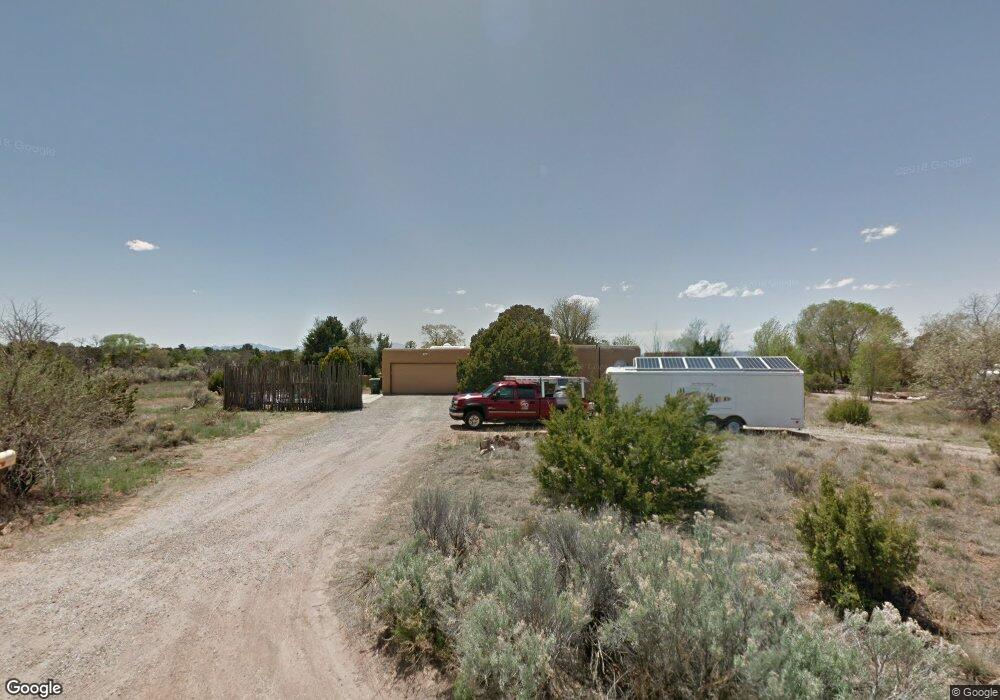
2110 Calle Tecolote Santa Fe, NM 87505
Arroyo Chamiso NeighborhoodEstimated Value: $716,704 - $772,000
4
Beds
2
Baths
1,875
Sq Ft
$396/Sq Ft
Est. Value
About This Home
This home is located at 2110 Calle Tecolote, Santa Fe, NM 87505 and is currently estimated at $742,676, approximately $396 per square foot. 2110 Calle Tecolote is a home located in Santa Fe County with nearby schools including E.J. Martinez Elementary School, Santa Fe High School, and Little Earth School.
Ownership History
Date
Name
Owned For
Owner Type
Purchase Details
Closed on
Jan 30, 2008
Sold by
Maccurdy Ruth K
Bought by
Nickerson Mark D and Feldman Monique D
Current Estimated Value
Purchase Details
Closed on
Apr 27, 2004
Sold by
Maccurdy Ruth K
Bought by
Maccurdy Ruth K
Home Financials for this Owner
Home Financials are based on the most recent Mortgage that was taken out on this home.
Original Mortgage
$33,800
Interest Rate
5.38%
Mortgage Type
New Conventional
Purchase Details
Closed on
Jan 30, 2004
Sold by
Maccurdy Ruth K
Bought by
M R & Ruth K Maccurdy Family Living Tr
Purchase Details
Closed on
Jul 5, 2001
Sold by
Maccurdy Marshall R and Maccurdy Ruth K
Bought by
Maccurdy M R and Maccurdy Ruth K
Purchase Details
Closed on
Jun 6, 1979
Sold by
Warnock Douglas G and Warnock Thelma
Bought by
Maccurdy M R and Maccurdy Ruth
Create a Home Valuation Report for This Property
The Home Valuation Report is an in-depth analysis detailing your home's value as well as a comparison with similar homes in the area
Home Values in the Area
Average Home Value in this Area
Purchase History
| Date | Buyer | Sale Price | Title Company |
|---|---|---|---|
| Nickerson Mark D | -- | None Available | |
| Maccurdy Ruth K | -- | Albuquerque Title | |
| Maccurdy Ruth K | -- | Albuquerque Title | |
| M R & Ruth K Maccurdy Family Living Tr | -- | Albuquerque Title | |
| Maccurdy M R | -- | -- | |
| Maccurdy M R | -- | -- |
Source: Public Records
Mortgage History
| Date | Status | Borrower | Loan Amount |
|---|---|---|---|
| Previous Owner | Maccurdy Ruth K | $33,800 |
Source: Public Records
Tax History Compared to Growth
Tax History
| Year | Tax Paid | Tax Assessment Tax Assessment Total Assessment is a certain percentage of the fair market value that is determined by local assessors to be the total taxable value of land and additions on the property. | Land | Improvement |
|---|---|---|---|---|
| 2024 | $2,692 | $353,282 | $152,981 | $200,301 |
| 2023 | $2,692 | $342,993 | $148,526 | $194,467 |
| 2022 | $2,633 | $333,003 | $144,200 | $188,803 |
| 2021 | $2,592 | $107,768 | $46,666 | $61,102 |
| 2020 | $2,514 | $104,629 | $46,666 | $57,963 |
| 2019 | $2,479 | $101,582 | $49,999 | $51,583 |
| 2018 | $2,439 | $99,199 | $49,999 | $49,200 |
| 2017 | $2,449 | $99,199 | $49,999 | $49,200 |
| 2016 | $2,321 | $96,815 | $50,000 | $46,815 |
| 2015 | $2,335 | $96,817 | $50,000 | $46,817 |
| 2014 | $2,482 | $106,134 | $49,950 | $56,184 |
Source: Public Records
Map
Nearby Homes
- 2175 Old Arroyo Chamiso Unit 1,,2,3,4,5,6
- 125 Chamiso Ln
- 150 Calle Ojo Feliz
- 149 Calle Ojo Feliz Unit B
- 157 Calle Ojo Feliz Unit D
- 2347 Botulph Rd
- 151 Calle Ojo Feliz
- 2328 Calle Camarico
- 2306 Brother Luke Place
- 2305 Brother Abdon Way
- 102 Calle Paula
- 1566 Camino Amado
- 2116 Conejo Dr
- 2210 Miguel Chavez Rd Unit 1616
- 2210 Miguel Chavez Rd Unit 723
- 2210 Miguel Chavez Rd Unit 924
- 2210 Miguel Chavez Rd Unit 812
- 2210 Miguel Chavez Rd Unit 511
- 2210 Miguel Chavez Rd Unit 112
- 2210 Miguel Chavez Rd Unit 1423
- 2114 Calle Tecolote
- 2113 Calle Azulejo
- 2108 Calle Tecolote
- 1884 Moonlight
- 113 Calle Paisano
- 112 Calle Palomita
- 2116 Calle Tecolote
- 2115 Calle Azulejo
- 112 Calle Paisano
- 2112 Calle Azulejo
- 111 Calle Paisano
- 110 Calle Palomita
- 2107 Calle Tecolote
- 2115 Calle Tecolote
- 2115 Calle Tecolote
- 2118 Calle Tecolote
- Tract 1A Blk 19 Unit 14
- 110 Calle Paisano
- 2104 Calle Tecolote
- 2114 Calle Azulejo